|
|
|
3.4 ELEMENTS
������������In reports we must back up our opinions with data, equations, drawings, etc. As a result we use a number of common items,
When these elements are included, there MUST be a mention of them in the written text.
These days it is common to cut and paste figures in software. Make sure
3.4.1 Figures
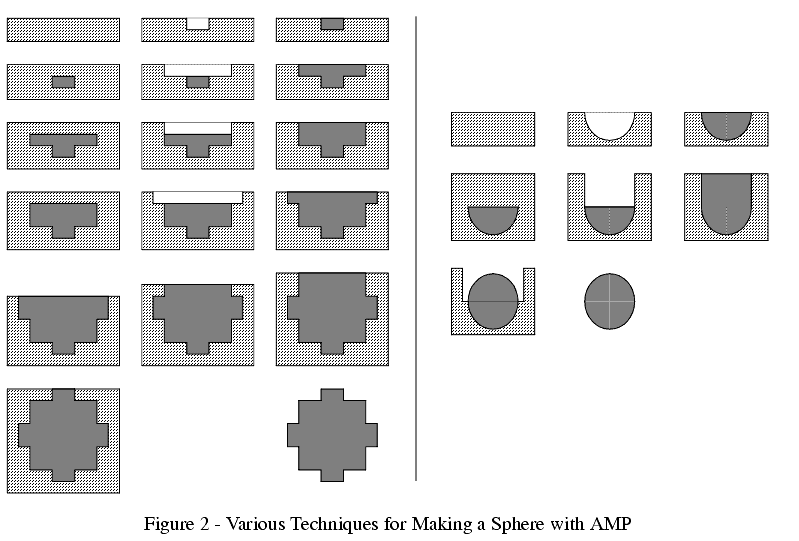
������������Figures include drawings, schematics, graphs, charts, etc.
They should be labelled underneath sequentially and given a brief title to distinguish it from other graphs. For example "Figure 1 - Voltage and currents for 50 ohm resistor"
In the body of the report the reference may be shortened to `Fig. 1'
The figures do not need to immediately follow the reference, but they should be kept in sequence. We will often move figures to make the type setting work out better.
If drawing graphs by computer,

3.4.2 Tables
������������Tables are often treated as figures.
They allow dense information presentation, typically numerical in nature.
Legends can be added to tables to help condense size.
3.4.3 Equations
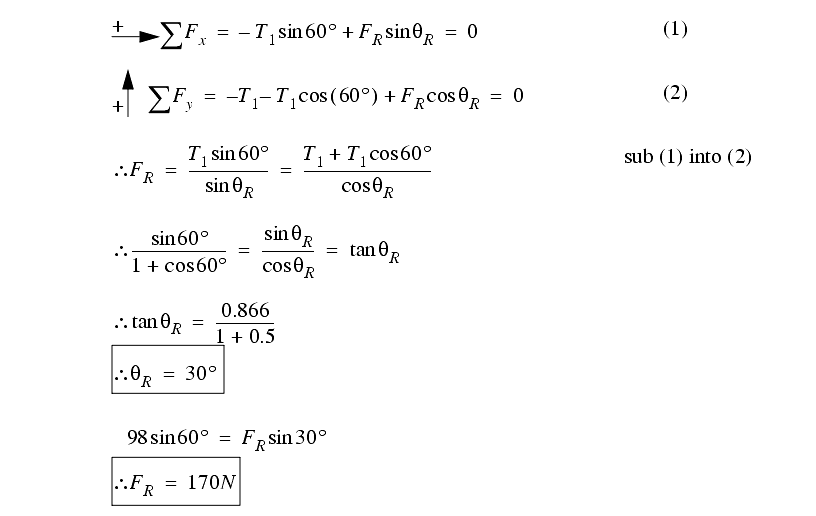
������������When presenting equations, use a good equation editor, and watch to make sure subscripts, etc are visible.
Number equations that are referred to in the text.
Box in equations of great significance.

3.4.4 Experimental Data
������������When analyzing the results from an experiment there are a few basic methods that may be used,
XXXXXXXXXXXXXX Add more XXXXXXXXXXXXXXXXX
3.4.5 References
������������References help provide direction to the sources of information when the information may be questioned, or the reader may want to get additional detail.
Reference formats vary between publication sources. But, the best rule is be consistent.
One popular method for references is to number them. The numbers are used in the body of the paper (eg, [14]), and the references are listed numerically at the end.
Another method is to list the author name and year (eg, [Yackish, 1997]) and then list the references at the end of the report.
Footnotes are not commonly used in engineering works.
3.4.6 Acknowledgments
������������When others have contributed to the work but are not listed as authors we may choose to recognize them.
Acknowledgments are brief statements that indicate who has contributed to a work.
3.4.7 Appendices
������������When we have information that is needed to support a report, but is too bulky to include, one option is to add an appendix.
Search for More: |

Custom Search
|

|