12.1 INTRODUCTION
������������
A system state is a mode of operation. Consider a bank machine that will go through very carefully selected states. The general sequence of states might be idle, scan card, get secret number, select transaction type, ask for amount of cash, count cash, deliver cash/return card, then idle.
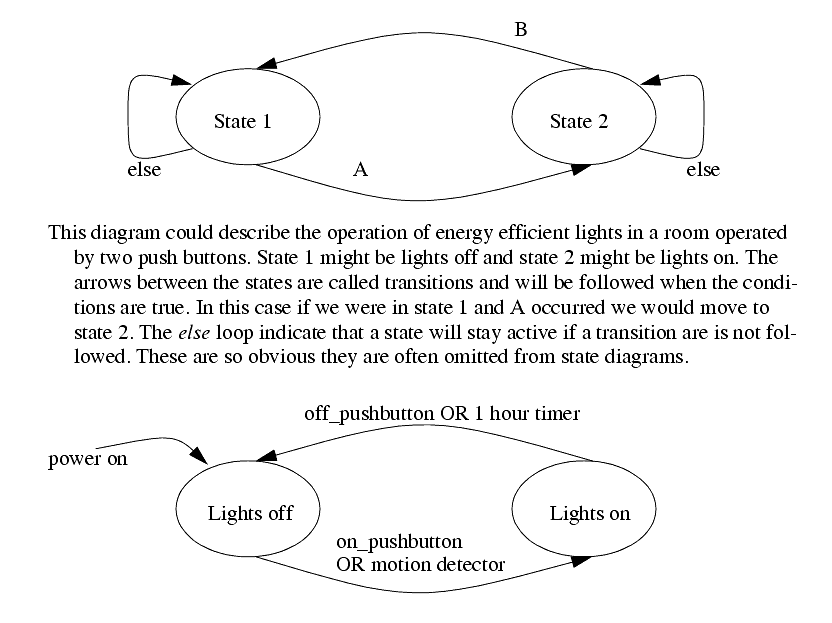
A State based system can be described with system states, and the transitions between those states. A state diagram is shown in Figure 138. The diagram has two states, State 1 and State 2. If the system is in state 1 and A happens the system will then go into state 2, otherwise it will remain in State 1. Likewise if the system is in state 2, and B happens the system will return to state 1. As shown in the figure this state diagram could be used for an automatic light controller. When the power is turned on the system will go into the lights off state. If motion is detected or an on push button is pushed the system will go to the lights on state. If the system is in the lights on state and 1 hour has passed, or an off push button is pushed then the system will go to the lights off state. The else statements are omitted on the second diagram, but they are implied.
Figure 138 A State Diagram
The most essential part of creating state diagrams is identifying states. Some key questions to ask are,
What does the system do normally?
Does the system behavior change?
Can something change how the system behaves?
Is there a sequence to actions?
2. List
modes of operation where the system is doing one identifiable activity that will start and stop. Keep in mind that some activities may just be to wait.
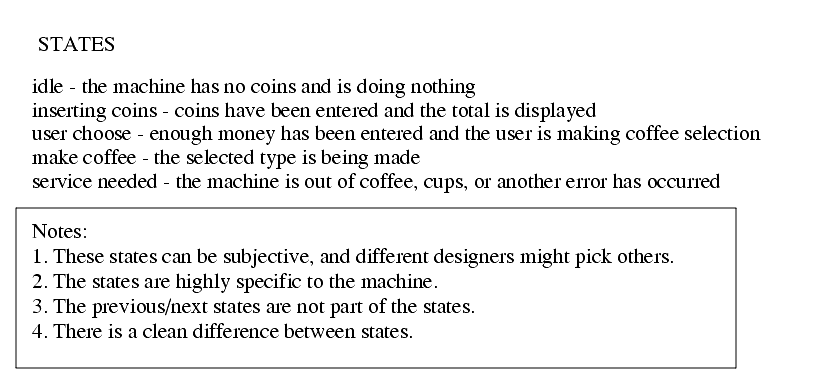
Consider the design of a coffee vending machine. The first step requires the identification of vending machine states as shown in Figure 139. The main state is the idle state. There is an inserting coins state where the total can be displayed. When enough coins have been inserted the user may select their drink of choice. After this the make coffee state will be active while coffee is being brewed. If an error is detected the service needed state will be activated.
Figure 139 Definition of Vending Machine States
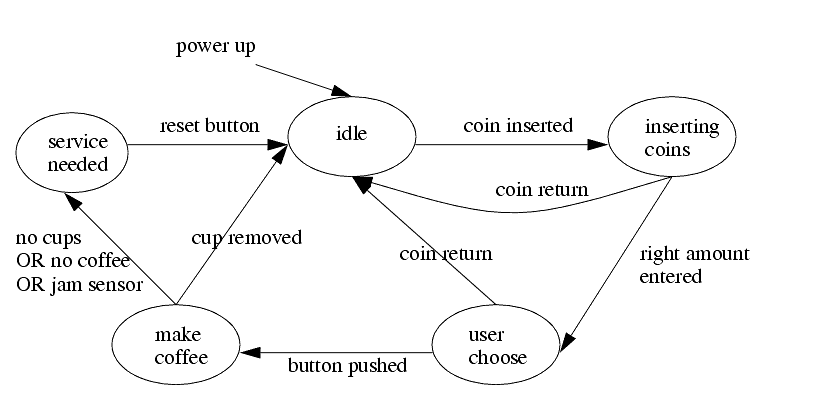
The states are then drawn in a state diagram as shown in Figure 140. Transitions are added as needed between the states. Here we can see that when powered up the machine will start in an idle state. The transitions here are based on the inputs and sensors in the vending machine. The state diagram is quite subjective, and complex diagrams will differ from design to design. These diagrams also expose the controller behavior. Consider that if the machine needs maintenance, and it is unplugged and plugged back in, the service needed statement would not be reentered until the next customer paid for but did not receive their coffee. In a commercial design we would want to fix this oversight.
Figure 140 State Diagram for a Coffee Machine
12.1.1 State Diagram Example
������������
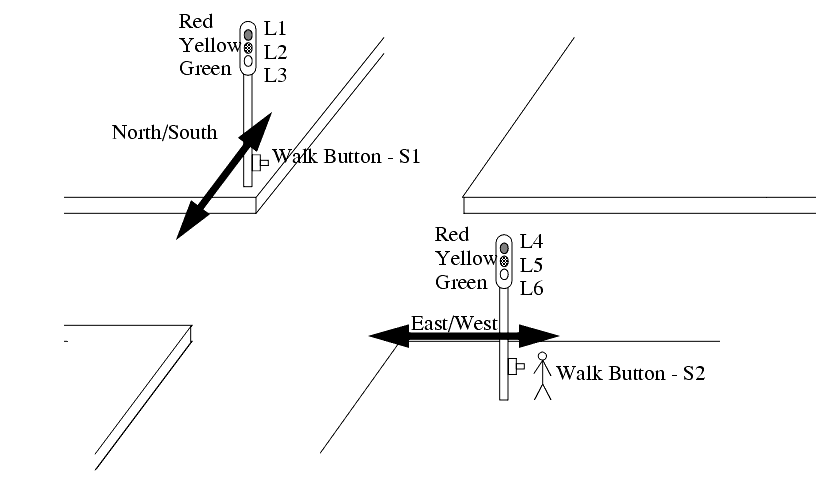
Consider the traffic lights in Figure 141. The normal sequences for traffic lights are a green light in one direction for a long period of time, typically 10 or more seconds. This is followed by a brief yellow light, typically 4 seconds. This is then followed by a similar light pattern in the other direction. It is understood that a green or yellow light in one direction implies a red light in the other direction. Pedestrian buttons are provided so that when pedestrians are present a cross walk light can be turned on and the duration of the green light increased.
Figure 141 Traffic Lights
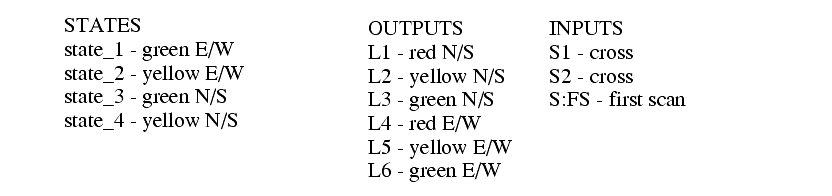
The first step for developing a controller is to define the inputs and outputs of the system as shown in Figure 142. First we will describe the system variables. These will vary as the system moves from state to state. Please note that some of these together can define a state (alone they are not the states). The inputs are used when defining the transitions. The outputs can be used to define the system state.
Figure 142 Inputs and Outputs for Traffic Light Controller
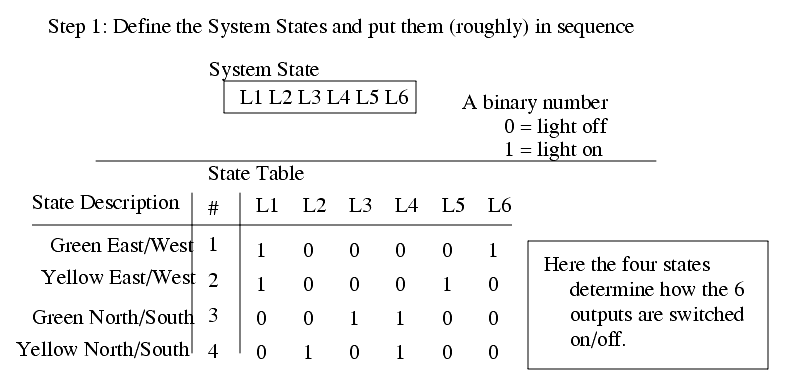
Previously state diagrams were used to define the system, it is possible to use a state table as shown in Figure 143. Here the light sequences are listed in order. Each state is given a name to ease interpretation, but the corresponding output pattern is also given. The system state is defined as the bit pattern of the 6 lights. Note that there are only 4 patterns, but 6 binary bits could give as many as 64.
Figure 143 System State Table for Traffic Lights
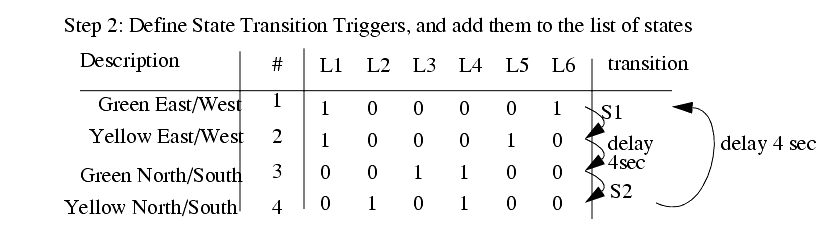
Transitions can be added to the state table to clarify the operation, as shown in Figure 144. Here the transition from Green E/W to Yellow E/W is S1. What this means is that a cross walk button must be pushed to end the green light. This is not normal, normally the lights would use a delay. The transition from Yellow E/W to Green N/S is caused by a 4 second delay (this is normal.) The next transition is also abnormal, requiring that the cross walk button be pushed to end the Green N/S state. The last state has a 4 second delay before returning to the first state in the table. In this state table the sequence will always be the same, but the times will vary for the green lights.
Figure 144 State Table with Transitions
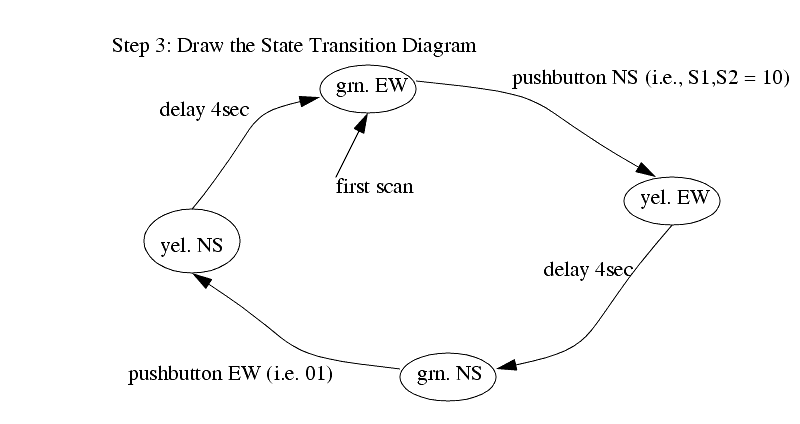
A state diagram for the system is shown in Figure 145. This diagram is equivalent to the state table in Figure 144, but it can be valuable for doing visual inspection.
Figure 145 A Traffic Light State Diagram
12.1.2 Conversion to Ladder Logic
������������
12.1.2.1 - Block Logic Conversion
State diagrams can be converted directly to ladder logic using block logic. This technique will produce larger programs, but it is a simple method to understand, and easy to debug. The previous traffic light example is to be implemented in ladder logic. The inputs and outputs are defined in Figure 146, assuming it will be implemented on an Allen Bradley Micrologix. first scan is the address of the first scan in the PLC. The locations state_1 to state_4 are internal memory locations that will be used to track which states are on. The behave like outputs, but are not available for connection outside the PLC. The input and output values are determined by the PLC layout.
Figure 146 Inputs and Outputs for Traffic Light Controller
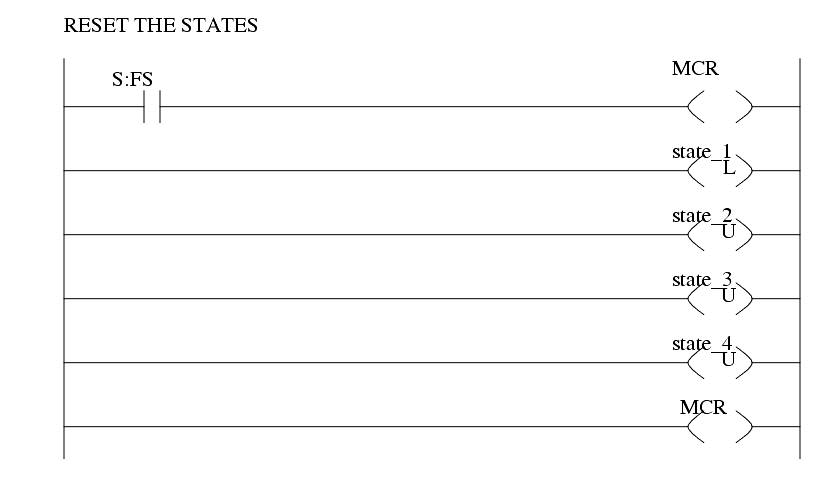
The initial ladder logic block shown in Figure 147 will initialize the states of the PLC, so that only state 1 is on. The first scan indicator first scan will execute the MCR block when the PLC is first turned on, and the latches will turn on the value for state_1 and turn off the others.
Figure 147 Ladder Logic to Initialize Traffic Light Controller
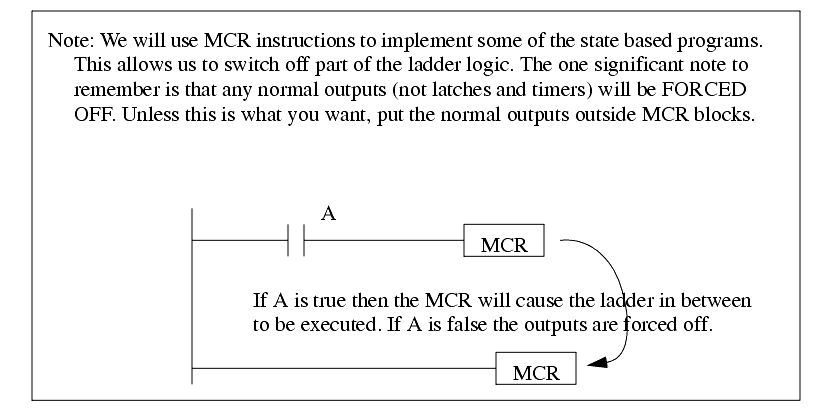
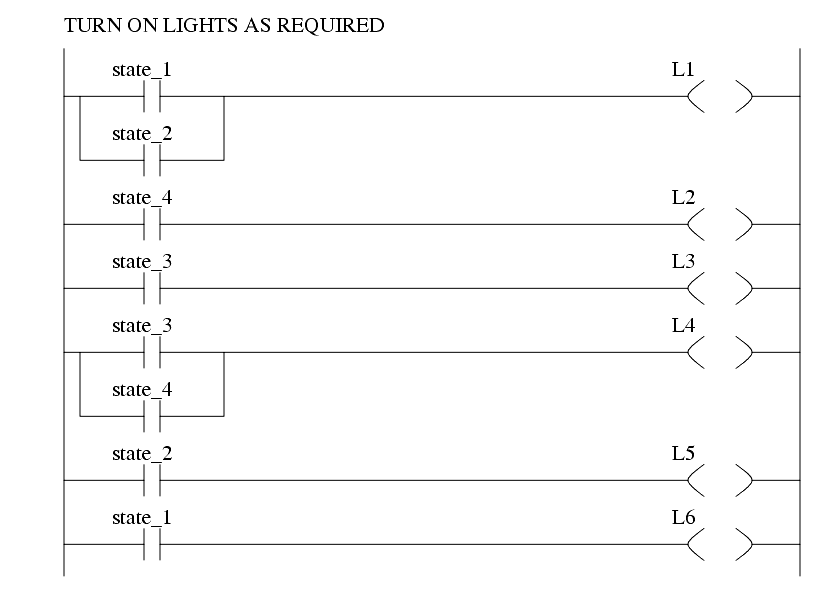
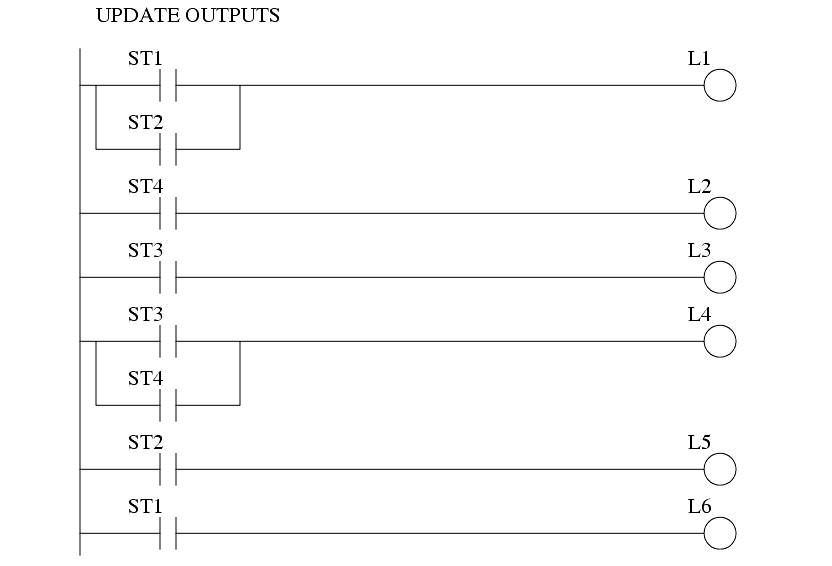
The next section of ladder logic only deals with outputs. For example the output O/1 is the N/S red light, which will be on for states 1 and 2, or B3/1 and B3/2 respectively. Putting normal outputs outside the MCR blocks is important. If they were inside the blocks they could only be on when the MCR block was active, otherwise they would be forced off. Note: Many beginners will make the careless mistake of repeating outputs in this section of the program.
Figure 148 General Output Control Logic
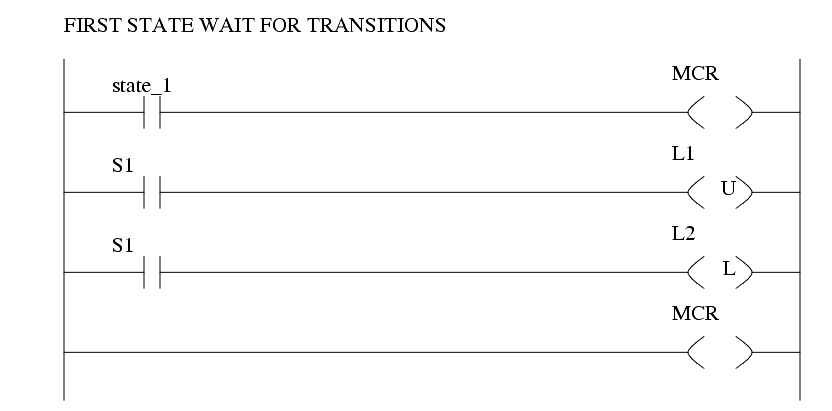
The first state is implemented in Figure 147. If state_1 is active this will be active. The transition is S1 which will end state_1 and start state_2.
Figure 149 Ladder Logic for First State
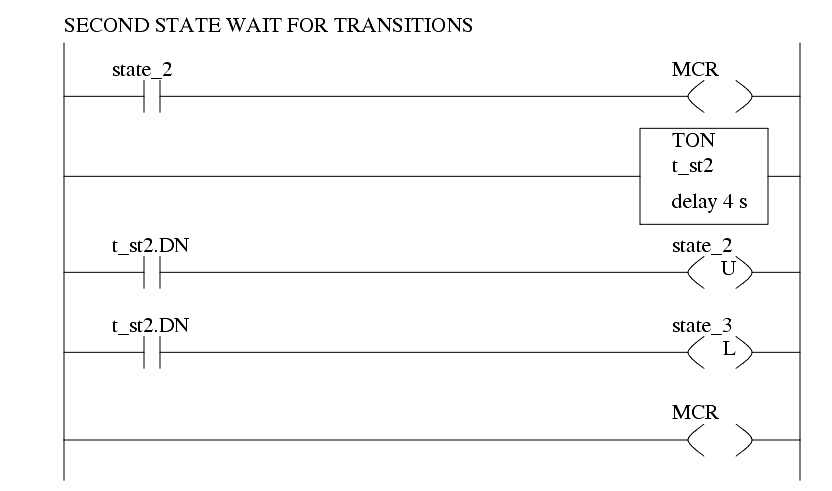
The second state is more complex because it involves a time delay, as shown in Figure 150. When the state is active the TON timer will be timing. When the timer is done state 2 will be unlatched, and state 3 will be latched on. The timer is nonretentive, so if state_2 if off the MCR block will force all of the outputs off, including the timer, causing it to reset.
Figure 150 Ladder Logic for Second State
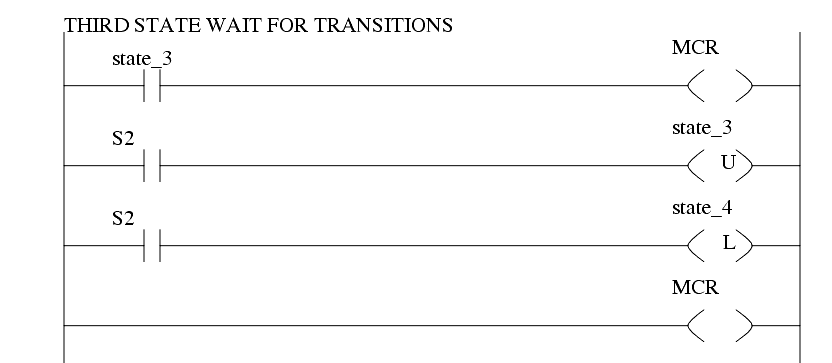
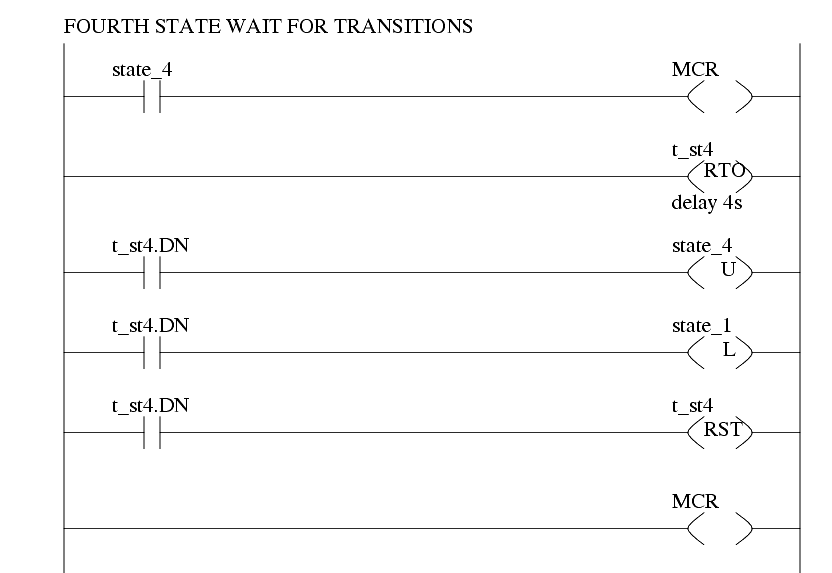
The third and fourth states are shown in Figure 151 and Figure 152. Their layout is very similar to that of the first two states.
Figure 151 Ladder Logic for State Three
Figure 152 Ladder Logic for State Four
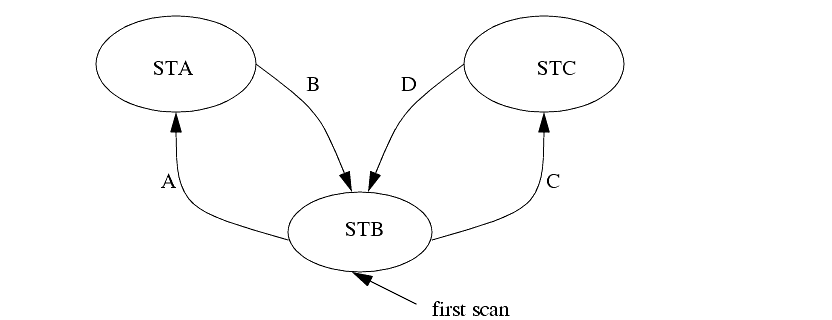
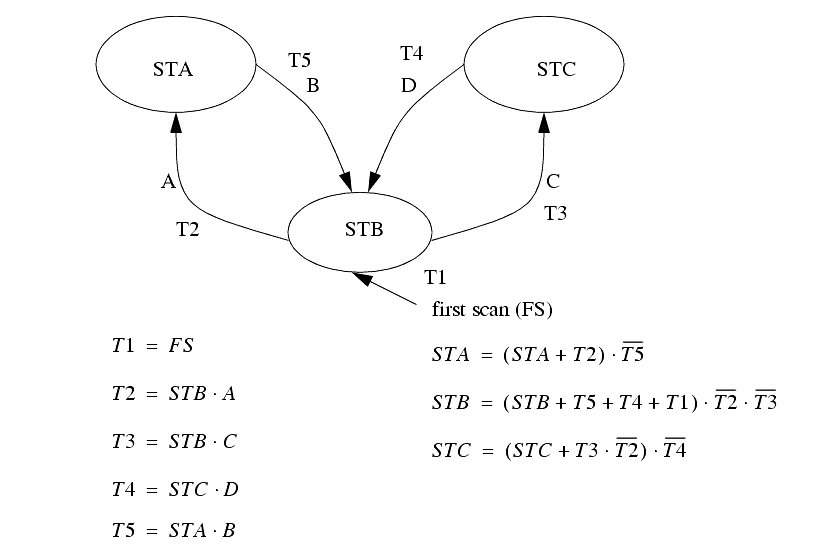
The previous example only had one path through the state tables, so there was never a choice between states. The state diagram in Figure 153 could potentially have problems if two transitions occur simultaneously. For example if state STB is active and A and C occur simultaneously, the system could go to either STA or STC (or both in a poorly written program.) To resolve this problem we should choose one of the two transitions as having a higher priority, meaning that it should be chosen over the other transition. This decision will normally be clear, but if not an arbitrary decision is still needed.
Figure 153 A State Diagram with Priority Problems
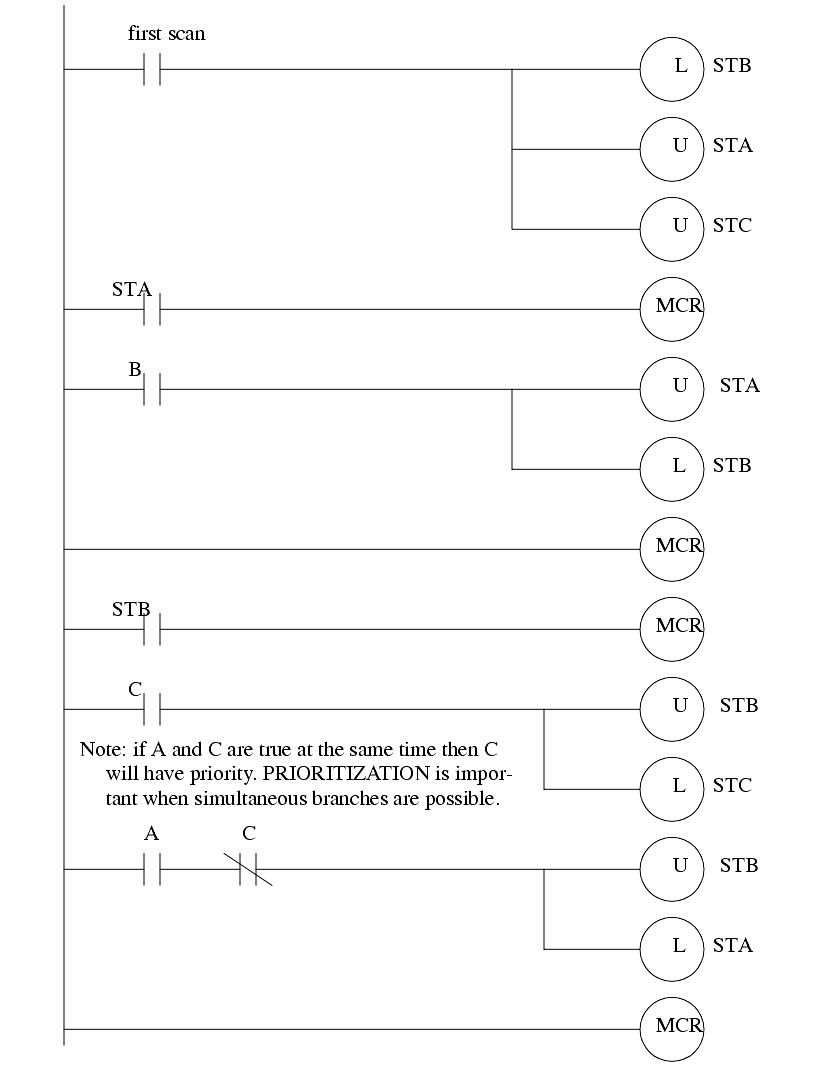
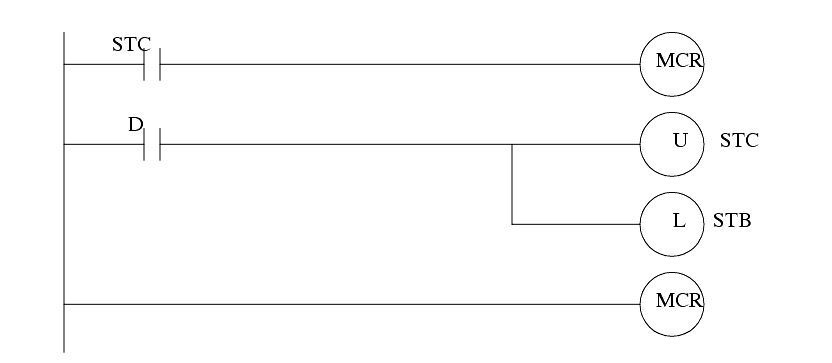
The state diagram in Figure 153 is implemented with ladder logic in Figure 154 and Figure 155. The implementation is the same as described before, but for state STB additional ladder logic is added to disable transition A if transition C is active, therefore giving priority to C.
Figure 154 State Diagram for Prioritization Problem
Figure 155 State Diagram for Prioritization Problem
The Block Logic technique described does not require any special knowledge and the programs can be written directly from the state diagram. The final programs can be easily modified, and finding problems is easier. But, these programs are much larger and less efficient.
12.1.2.2 - State Equations
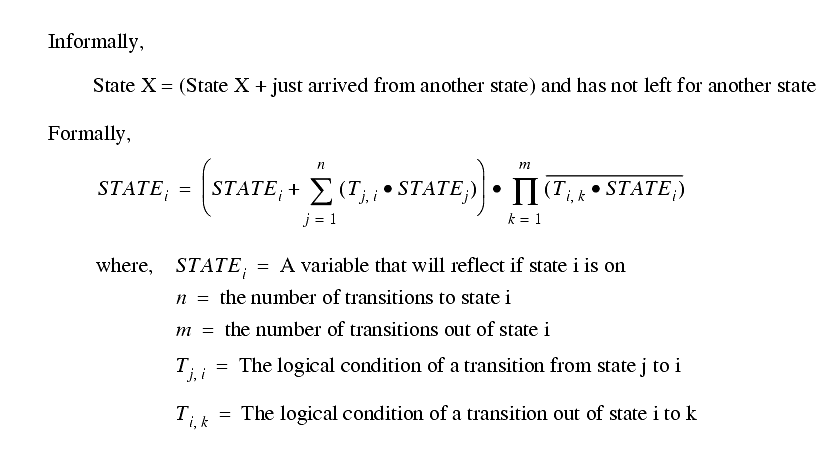
State diagrams can be converted to Boolean equations and then to Ladder Logic. The first technique that will be described is state equations. These equations contain three main parts, as shown below in Figure 156. To describe them simply - a state will be on if it is already on, or if it has been turned on by a transition from another state, but it will be turned off if there was a transition to another state. An equation is required for each state in the state diagram.
Figure 156 State Equations
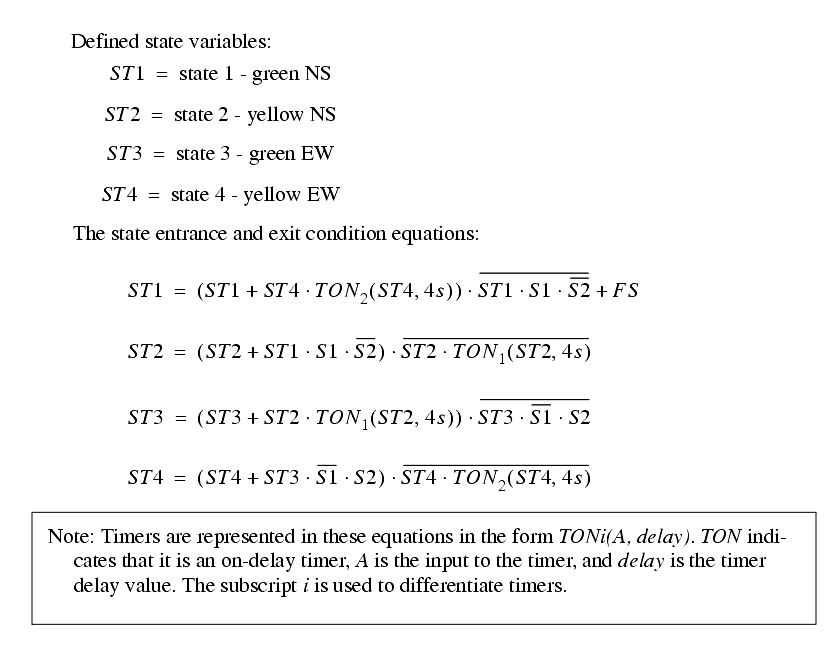
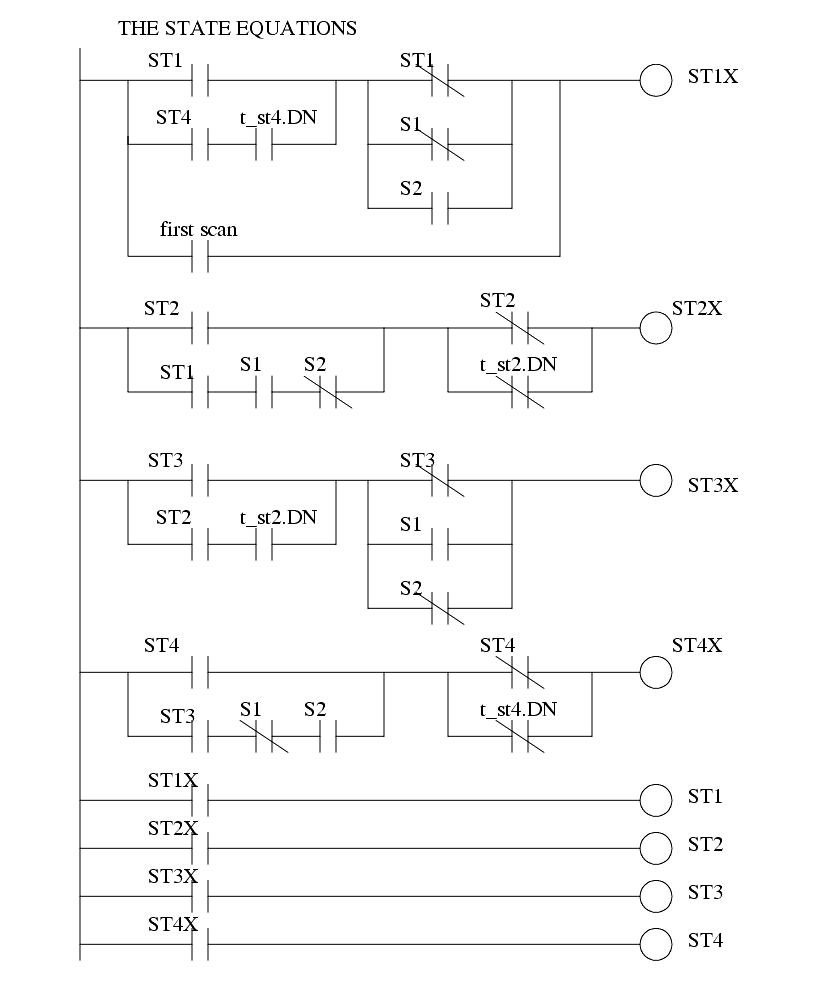
The state equation method can be applied to the traffic light example in Figure 145. The first step in the process is to define variable names (or PLC memory locations) to keep track of which states are on or off. Next, the state diagram is examined, one state at a time. The first equation if for ST1, or state 1 - green NS. The start of the equation can be read as ST1 will be on if it is on, or if ST4 is on, and it has been on for 4s, or if it is the first scan of the PLC. The end of the equation can be read as ST1 will be turned off if it is on, but S1 has been pushed and S2 is off. As discussed before, the first half of the equation will turn the state on, but the second half will turn it off. The first scan is also used to turn on ST1 when the PLC starts. It is put outside the terms to force ST1 on, even if the exit conditions are true.
Figure 157 State Equations for the Traffic Light Example
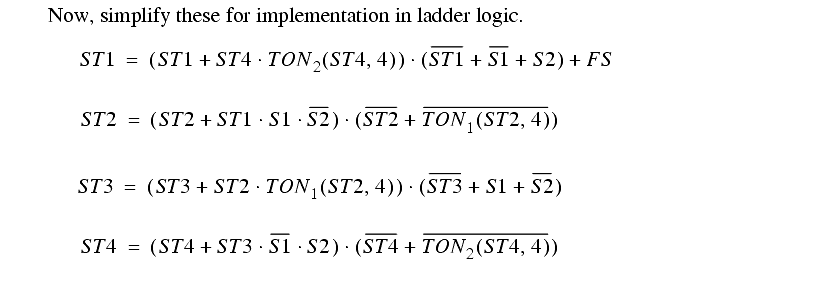
The equations in Figure 157 cannot be implemented in ladder logic because of the NOT over the last terms. The equations are simplified in Figure 158 so that all NOT operators are only over a single variable.
Figure 158 Simplified Boolean Equations
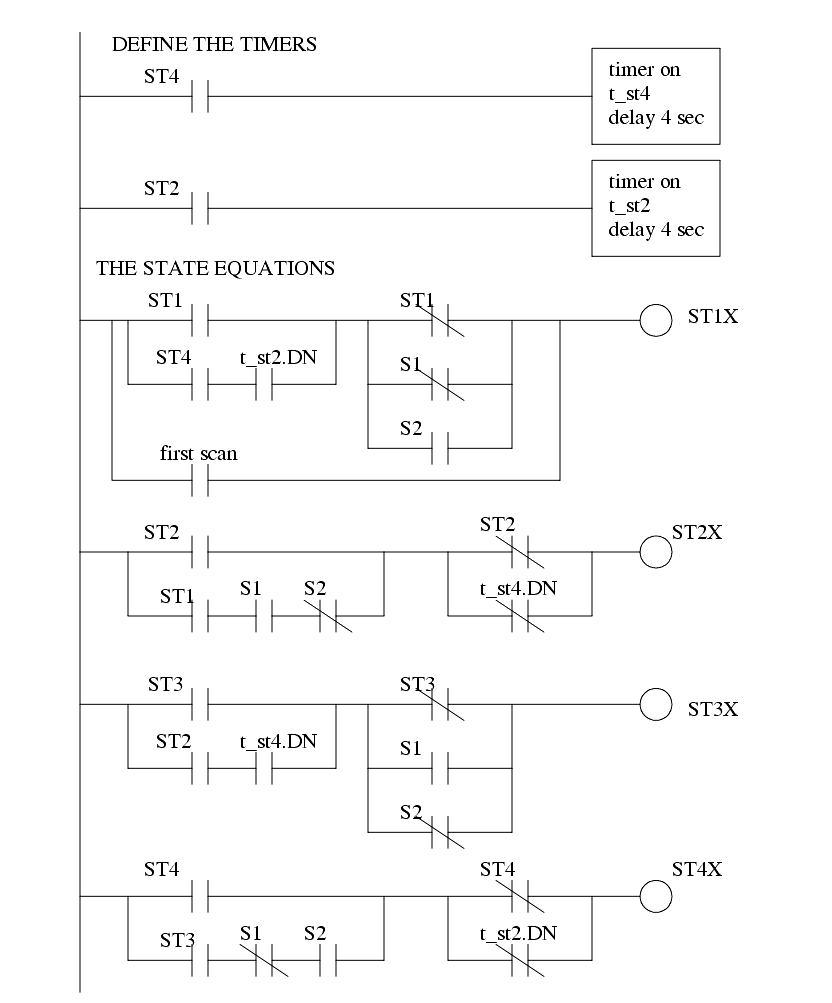
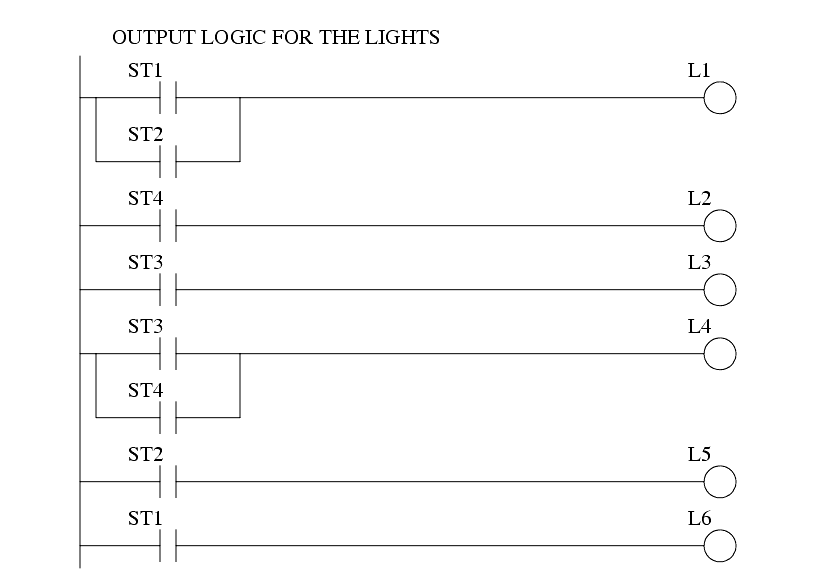
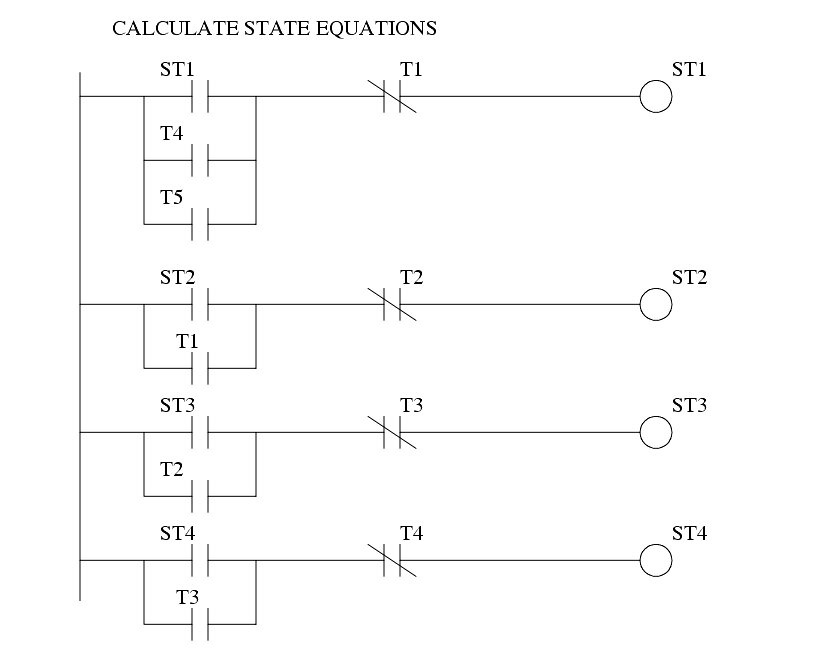
These equations are then converted to the ladder logic shown in Figure 159 and Figure 160. At the top of the program the two timers are defined. (Note: it is tempting to combine the timers, but it is better to keep them separate.) Next, the Boolean state equations are implemented in ladder logic. After this we use the states to turn specific lights on.
Figure 159 Ladder Logic for the State Equations
Figure 160 Ladder Logic for the State Equations
This method will provide the most compact code of all techniques, but there are potential problems. Consider the example in Figure 160. If push button S1 has been pushed the line for ST1 should turn off, and the line for ST2 should turn on. But, the line for ST2 depends upon the value for ST1 that has just been turned off. This will cause a problem if the value of ST1 goes off immediately after the line of ladder logic has been scanned. In effect the PLC will get lost and none of the states will be on. This problem arises because the equations are normally calculated in parallel, and then all values are updated simultaneously. To overcome this problem the ladder logic could be modified to the form shown in Figure 161. Here some temporary variables are used to hold the new state values. After all the equations are solved the states are updated to their new values.
Figure 161 Delayed State Updating
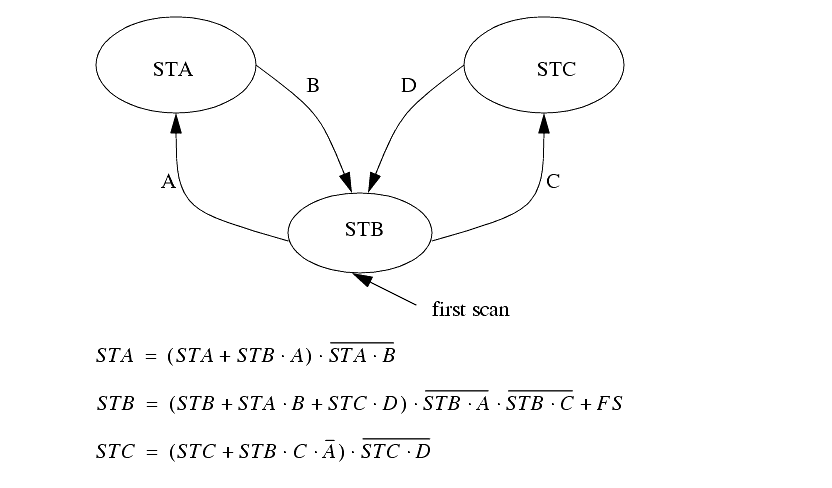
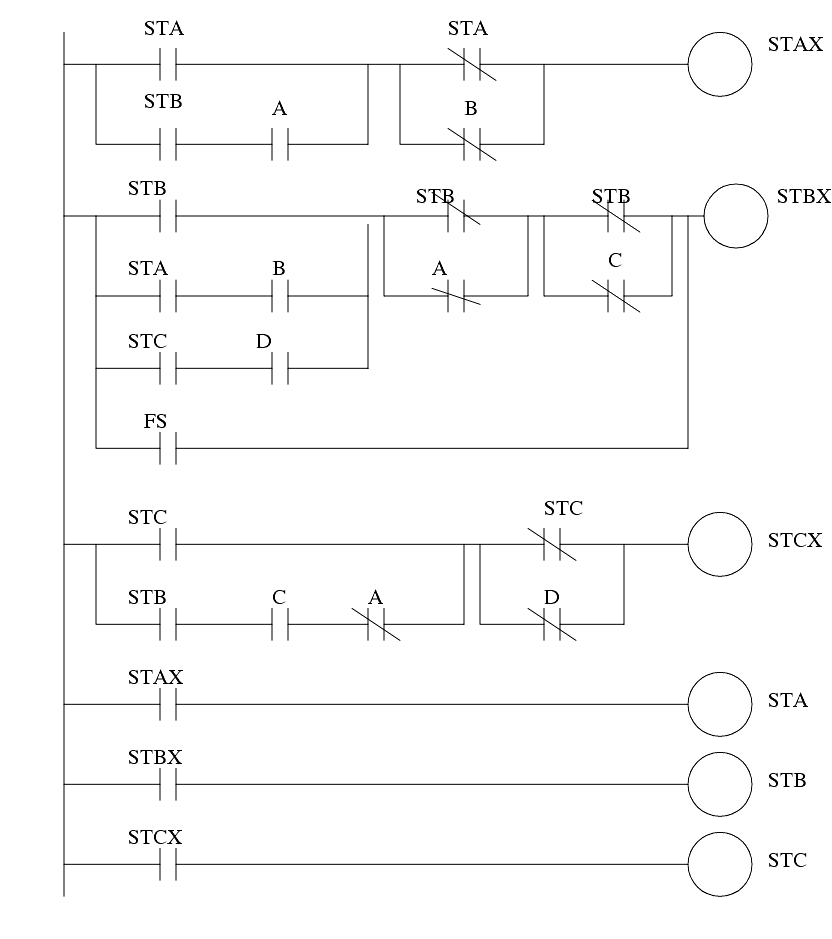
When multiple transitions out of a state exist we must take care to add priorities. Each of the alternate transitions out of a state should be give a priority, from highest to lowest. The state equations can then be written to suppress transitions of lower priority when one or more occur simultaneously. The state diagram in Figure 162 has two transitions A and C that could occur simultaneously. The equations have been written to give A a higher priority. When A occurs, it will block C in the equation for STC. These equations have been converted to ladder logic in Figure 163.
Figure 162 State Equations with Prioritization
Figure 163 Ladder Logic with Prioritization
12.1.2.3 - State-Transition Equations
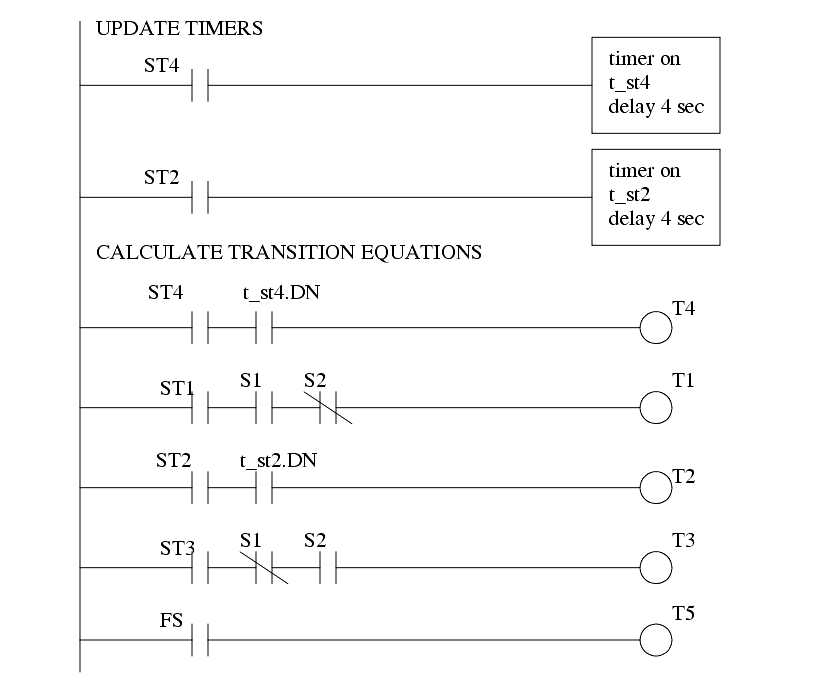
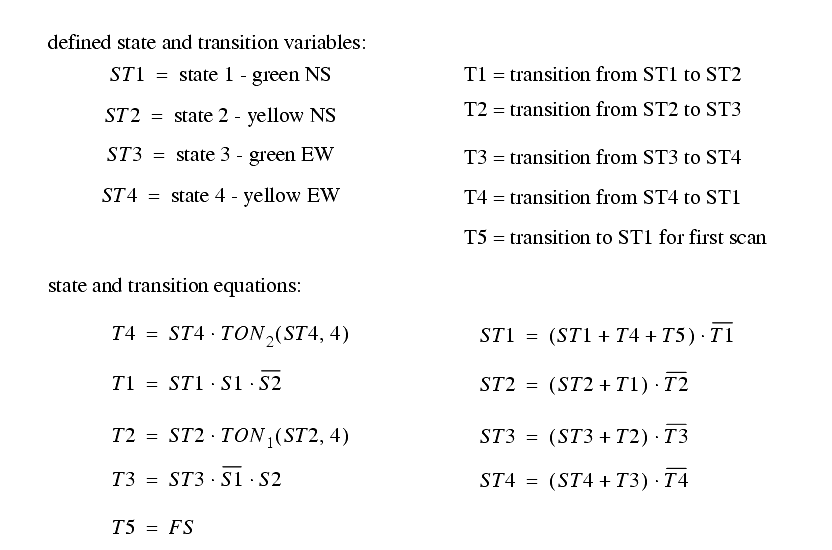
A state diagram may be converted to equations by writing an equation for each state and each transition. A sample set of equations is seen in Figure 164 for the traffic light example of Figure 145. Each state and transition needs to be assigned a unique variable name. (Note: It is a good idea to note these on the diagram) These are then used to write the equations for the diagram. The transition equations are written by looking at the each state, and then determining which transitions will end that state. For example, if ST1 is true, and crosswalk button S1 is pushed, and S2 is not, then transition T1 will be true. The state equations are similar to the state equations in the previous State Equation method, except they now only refer to the transitions. Recall, the basic form of these equations is that the state will be on if it is already on, or it has been turned on by a transition. The state will be turned off if an exiting transition occurs. In this example the first scan was given it's own transition, but it could have also been put into the equation for T4.
|
Figure 164 State-Transition Equations
These equations can be converted directly to the ladder logic in Figure 165, Figure 166 and Figure 167. It is very important that the transition equations all occur before the state equations. By updating the transition equations first and then updating the state equations the problem of state variable values changing is negated - recall this problem was discussed in the State Equations section.
Figure 165 Ladder Logic for the State-Transition Equations
Figure 166 Ladder Logic for the State-Transition Equations
Figure 167 Ladder Logic for the State-Transition Equations
The problem of prioritization also occurs with the State-Transition equations. Equations were written for the State Diagram in Figure 168. The problem will occur if transitions A and C occur simultaneously. In the example transition T2 is given a higher priority, and if it is true, then the transition T3 will be suppressed when calculating STC. In this example the transitions have been considered in the state update equations, but they can also be used in the transition equations.
Figure 168 Prioritization for State Transition Equations