21.3 DESIGN CASE
������������
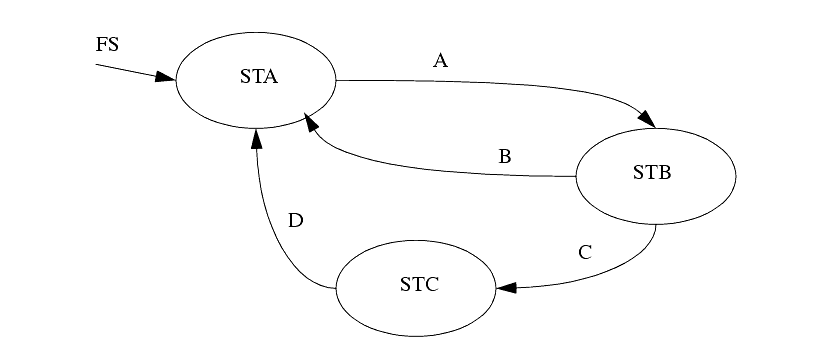
A simple state diagram is shown in Figure 306.
Figure 306 An Example State Diagram
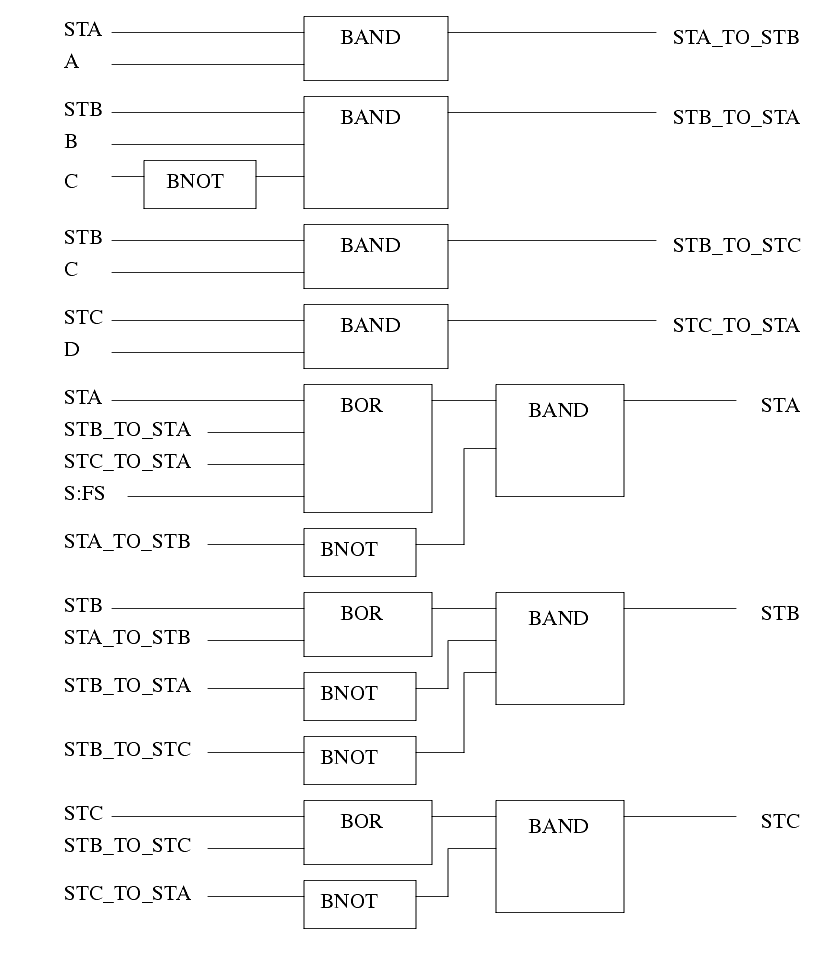
The state diagram is implemented in FBD form in Figure 307. In this case the transition equations approach was used, although other methods are equally applicable. The transitions 'STA_TO_STB', "STB_TO_STA', 'STB_TO_STC', and 'STC_TO_STA' are calculated first. These are then used to update the states 'STA', 'STB', and 'STC'. Additional program steps could then be added to drive outputs.
Figure 307 An FBD Implementation of a State Diagram Using Transition Equations


