10.2 BODE PLOTS
������������
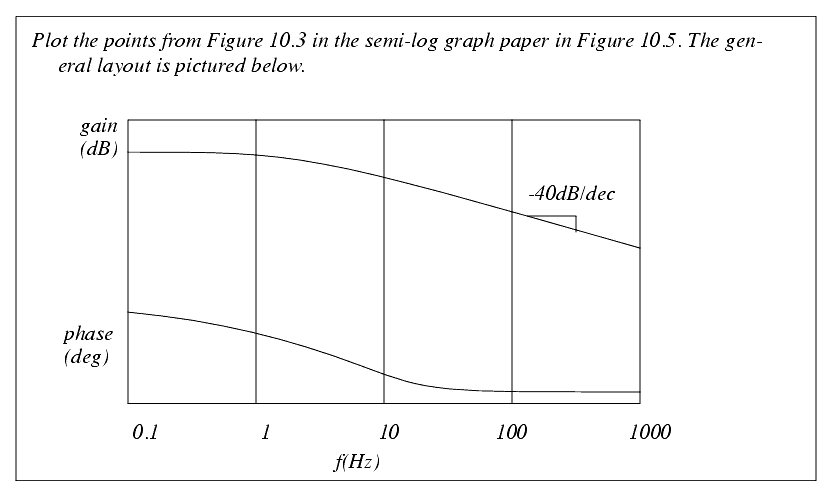
In the previous section we calculated a table of gains and phase angles over a range of frequencies. Graphs of these values are called Bode plots. These plots are normally done on semi-log graph paper, such as that seen in Figure 10.5. Along the longer axis of this paper the scale is logarithmic (base 10). This means that if the paper started at 0.1 on one side, the next major division would be 1, then 10, then 100, and finally 1000 on the other side of the paper. The basic nature of logarithmic scales prevents the frequency from being zero. Along the linear axis (the short one) the gains and phase angles are plotted, normally with two graphs side-by-side on a single sheet of paper.
Figure 10.5 4 cycle semi-log graph paper
Figure 10.6 Drill problem: Plot the points from
Figure 10.3 on graph paper
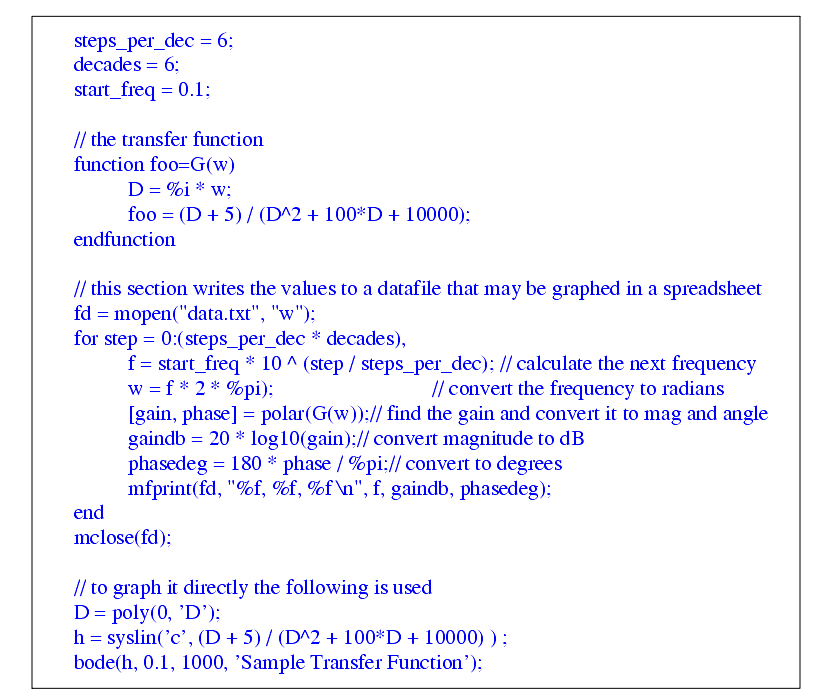
Figure 10.7 Aside: Bode Plot Example with Scilab
Figure 10.8 Drill problem: Plot the points from
Figure 10.2 with a computer
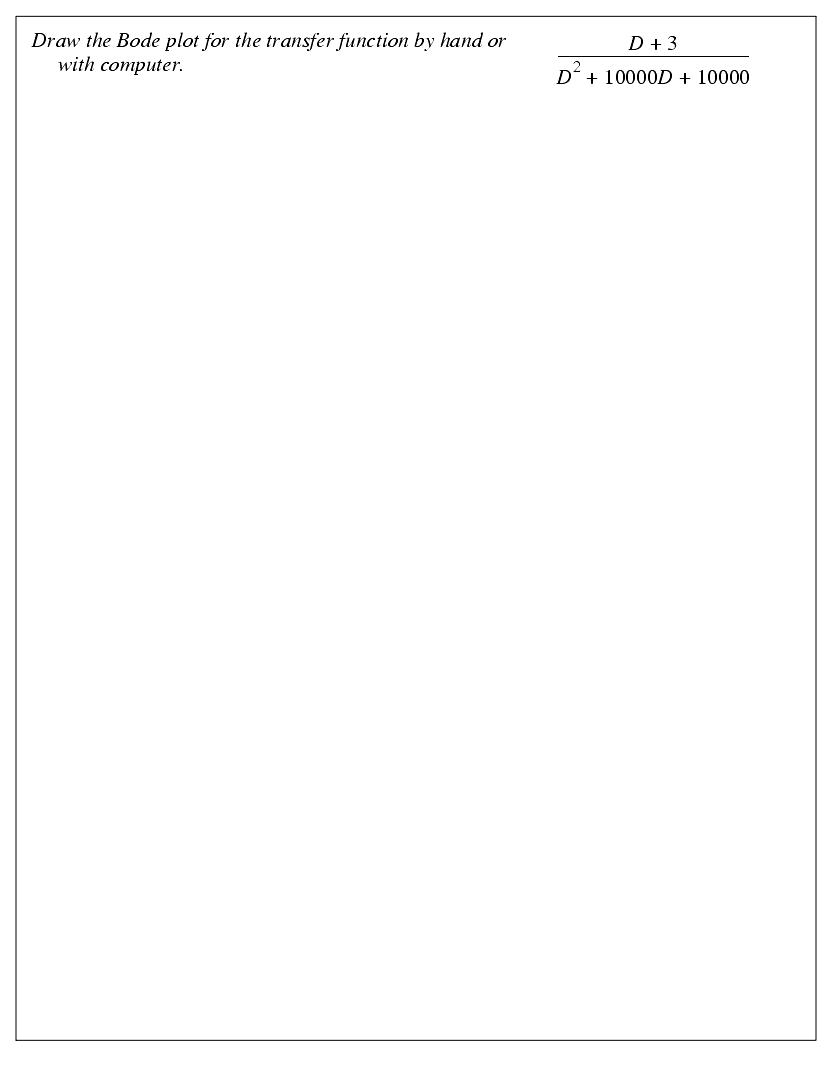
Figure 10.9 Drill problem: Draw the Bode plot for gain and phase