|
|
|
40.8 Nyquist Plot
������������The method is used to determine system stability using the characteristic equation 1+Gc(s)G(s)H(s)
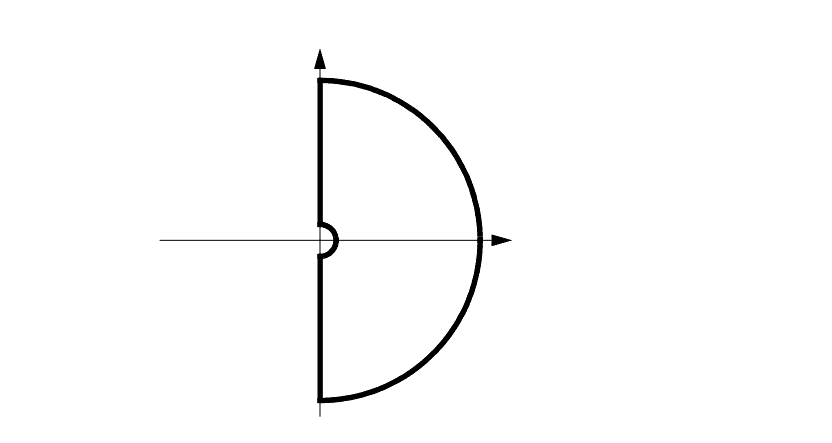
If over the range of frequencies the system enters the unstable range of the Nyquists contour shown below.

The basic method for producing polar plots is,
If the number of clockwise encirclements is equal to the number of poles in the right hand side of the plane, the system is stable.
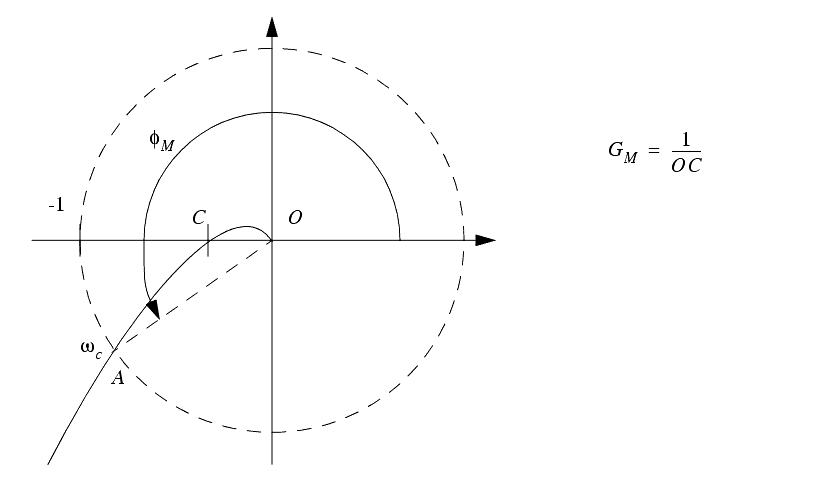
The gain and phase margins can be determined from the polar plot as shown below,

Search for More: |

Custom Search
|

|