|
|
|
40.9 NICHOLS CHART
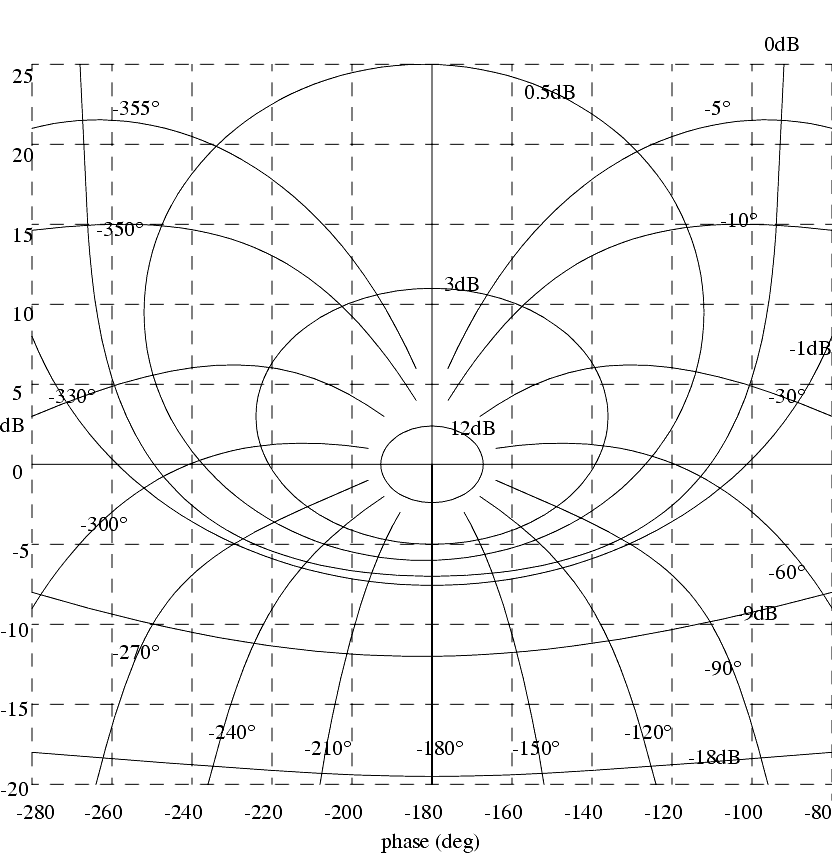
������������- a plot of the gain vs. the angle of a system transfer function after a phasor transform.
3. Gain and phase values are calculated for a large range of frequencies and plotted on the following paper.

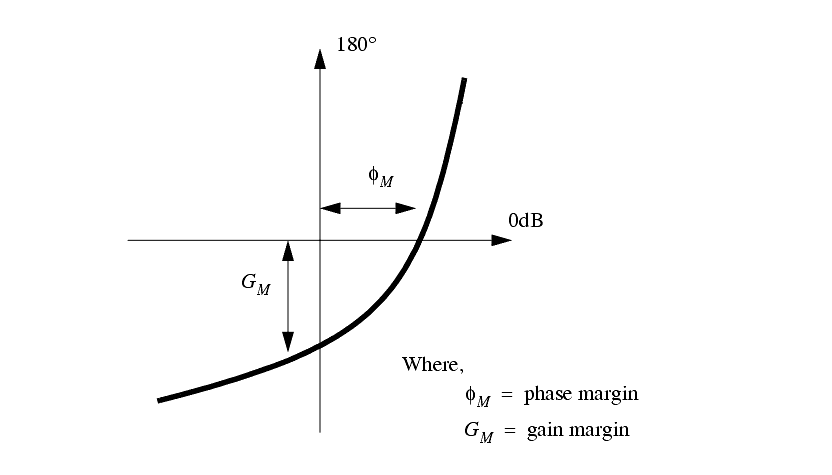
The gain and phase margins are measured from the plot as shown below,

These correlate to values on the Bode plot. To find the approximate gain/phase margins with a Bode plot, locate the point where the gain is 180° to find the gain margin, and find the phase margin where the gain is 0dB.
In unstable systems the function will circle the center point of the plot.
Search for More: |

Custom Search
|

|