|
|
|
2.4 Program Evaluation and Review Technique (PERT)
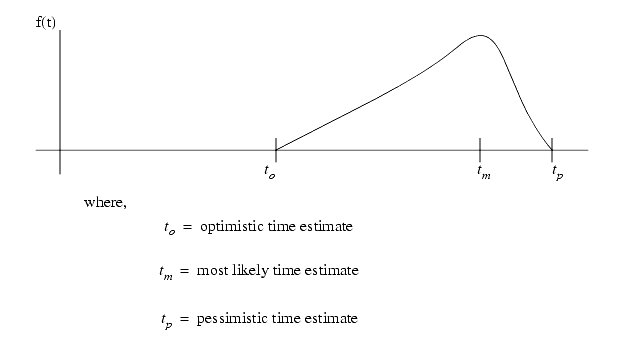
������������In CPM we assume that each activity has a fixed time, in practice the task lengths vary. This variation can be shown with the Beta distribution.

task times are expressed with three numbers separated by dashes to-tm-tp to represent task times.
the mean (effective) time can be found with,

A Standard Deviation for each activity time can be approximated using,

The te valuaes can be used to do a CPM analysis of a network diagram. Once the Critical Path is identified the overal task time and variance can be calculated using,

To find the chance that the process will be done by the time Ts, the z value can be calculated. The z value can then be used to find the probability of completion using the cummulative normal distribution function.

Search for More: |

Custom Search
|

|