To develop a differential equation that models a brushed DC motor
DC motors will generate a torque between the rotor and stator that is related to the applied voltage or current. When a voltage is applied the resulting current will generate a torque causing the rotor to accelerate. For any voltage and load on the motor there will tend to be a final angular velocity due to friction and drag in the motor. And, for a given voltage the ratio between steady-state torque and speed will be a straight line.

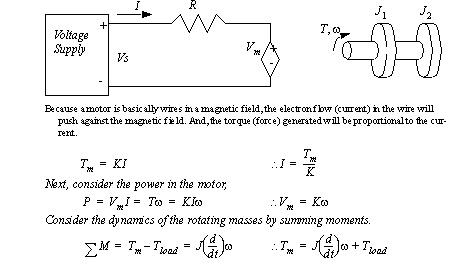
The basic equivalent circuit model for the motor is shown below. We can develop equations for this model. This model must also include the rotational inertia of the rotor and any attached loads. On the left hand side is the resistance of the motor and the ’back emf’ dependent voltage source. On the right hand side the inertia components are shown. The rotational inertia J1 is the motor rotor, and the second inertia is an attached disk.
The model can now be considered as a complete system.
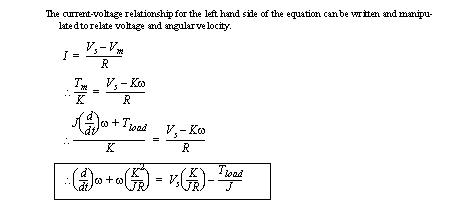
Looking at this relationship we see a basic first-order differential equation. We can measure motor properties using some basic measurements.

Figure 26.1 The torque and inertia in a basic motor model
These basic equations can be manipulated into the first-order differential equation in Figure 26.2 The first-order model of a motor.

Figure 26.2 The first-order model of a motor
A method for calculating motors parameters given the motor response to a step input is shown in Figure 26.3 Estimating motor parameters from performance. In this example the motor windings had a measured resistance of 40 ohms. When a 15V step input was applied, the motor ran with a steady state velocity of 2400 RPM. The motor responded to the input with a time constant of 0.5s.

Figure 26.3 Estimating motor parameters from performance
1. Integrate the differential equation to find an explicit function of speed as a function of time.
2. Develop a plan for measuring motor parameters. Also include sample calculations for finding the motor parameters values (with units), K, R, J.
3. Write a program for the ATMega32 that will set the PWM output and collect data for tachometer speed. Hitting the ’R’ key will make the process idle, with a PWM output of 0. Hitting a key between ’0’ and ’9’ will set the PWM output value between 0 and 255 in equal divisions. At this point the program should begin to collect analog input values every 10ms and save these in an array for 1 second. After the data collection period, the PWM output should stop and the program should become idle. Hitting the ’D’ key should dump the data to the screen so that it can be saved and plotted in Excel. The program should also include deadband compensation.
computer with a WinAVR compiler
TIP-122 Darlington coupled transistor, L293D, or L298
1. With the motor disconnected from all other parts of the circuit, measure the resistance across the motor terminals. You may need to rotate the shaft slightly (and slowly) as the resistance will vary as the motor brushes and commutator make/break contact.
2. Connect the motor and the ATMega32 board so that the PWM output drives the motor with the TIP 120/122 transistor or L293D. The motor shaft should be connected to the motor being used as the tachometer.
3. Enter and test the program, and determine the motor deadband. Enable the deadband before collecting experimental data.
4. Use a strobe light to find the relationship between the tachometer voltage and the angular speed.
5. Obtain velocity curves for the motor with different voltage step functions. Use these to determine the motor parameters. Note: it is useful to use a range of voltages so that the data includes a wide range of steady state angular velocities.