25. Lab 6: Motion ControlTo use a setpoint table to generate smooth motion profiles. A simple (e.g., proportional) controller will move faster when further from the setpoint (desired position). This means at the start of motion there is normally a period of fast acceleration, resulting in a ’jerk’ and high acceleration. At the end of motion the controller slows smoothly to a stop. In many cases we prefer motion that starts and stops smoothly. This is achieved by adding motion control. A block diagram for a motion controller is shown in Figure 25.1 Motion generation. In this system a target position is used to generate a set of points and times along a smooth path in a setpoint schedule table. These points are then used as setpoints for the feedback control loop. Motion starts at the beginning of the table with the first setpoint. At the given times, the setpoint is updated to the new value in the table. In this system the controller is always shooting for the next point on a smooth path. 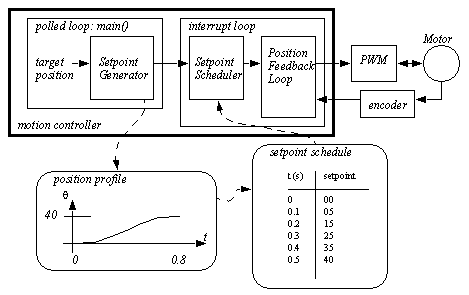
There are multiple methods for generating a smooth motion path, this section outlines two of these. The first is shown in Figure 25.2 Generating smooth motion paths, it controls motion using a parametric function ’p(u)’. The function value varies from 0 to 1 as the parameter ’u’ varies from 0 to 1. However, the parameters of the function are selected so that the motion starts and stops with a velocity of zero. In this case the final polynomial equation, (3), is fairly simple. This equation can then be used in equation (1) to generate a smooth motion path between any arbitrary start and end point, with arbitrary start and end times. 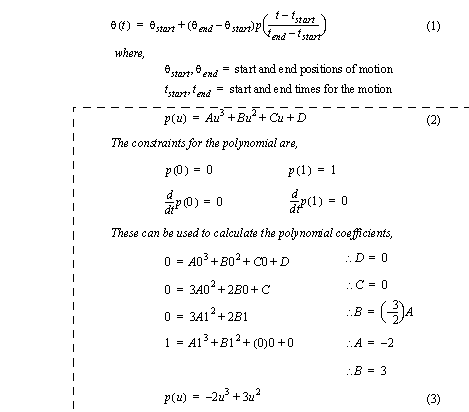
Figure 25.2 Generating smooth motion paths The example in Figure 25.3 Generating smooth motion paths shows the use of a trigonometric function, instead of a polynomial. This function was used to generate the points in the following sample program in Figure 25.4 Subroutines for motion profile generation and use. 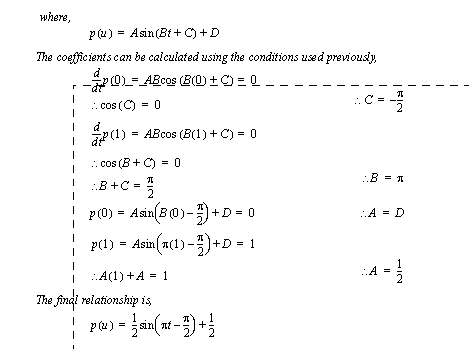
Figure 25.3 Generating smooth motion paths The program in Figure 25.4 Subroutines for motion profile generation and use generates a motion table that can then be used to update setpoints. The function ’table_init()’ must be called once when the program starts to set up global time and table values. When a new target position has been specified the ’table_generate()’ function is called to generate the setpoint table. The ’table_update()’ function is called once every interrupt scan to check the setpoint table, and update the global setpoint variable, ’point_current’ at scheduled times. This function also includes a simple clock to keep track of the system time. 
Figure 25.4 Subroutines for motion profile generation and use 1. Modify the subroutines in the prelab to use 15 motion points, instead of 11. 2. Write a program to use the setpoint generation routines with the position feedback control system developed in previous labs. The user interface should allow the user to increment or decrement a target value using ’i’ or ’d’. The user should be able to set the duration using key ’0’ to ’9’. The target value will not update the motion table until ’g’ is input. ’s’ will stop the motion. computer with a WinAVR compiler ATMega32 board with an L293D (or L298) Push-pull four channel driver 1. Connect the control system using an L293D to drive the motor, and an encoder as done in previous labs. 2. Test the program developed for the prelab. Determine all necessary parameters, such as the deadband limits. 3. For the proportional and integral gain values use Kp=10, Ki = 0. Supply different setpoints and measure the steady state position and record other observations. 4. Repeat step 3 for different values of proportional and integral gains. 5. Tune the system by varing the PID parameters until the motion is smooth. First vary the P gain, then the I gain, and then finally the D gain. 6. Vary the time of the motion and observe the system behavior. 7. Vary the motion distance and observe the changes. 8. Plot the results on a single graph, be sure to indicate the setpoints. |