To use the Atmega32 microcontroller for velocity feedback control of a motor.
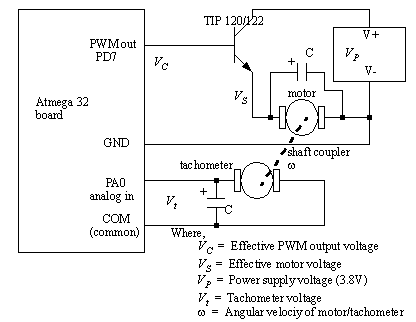
A basic feedback control system is shown in Figure 22.1 Atmega32 based velocity feedback controller. In this system the atmega32 will output a control voltage as a PWM signal. When the output is 0V, the transistor will be off, and act like an open switch. However, when the output is 5V, it will turn the transistor on, and allow current to flow to the motor. (Note: There will be a voltage drop across the transistor, in this case approximately 0.8V.) The motor shaft is connected to a tachometer to measure the motor speed. (Note: In this lab we will use another motor as the tachometer.) The tachometer will produce a voltage proportional to the motor speed.

Figure 22.1 Atmega32 based velocity feedback controller
To complete the control system, a program is required. The program reads the motor speed input, Ct, from the analog voltage, Vt, and use it to adjust the output, Cc, to adjust the voltage, Vs, to control the motor speed. Normally a user may supply a setpoint, Cd. This setpoint indicates the desired speed. In this program care is required to ensure that the Cc value remains in the range from 0 to 255 because of the limitation of the PWM functions.
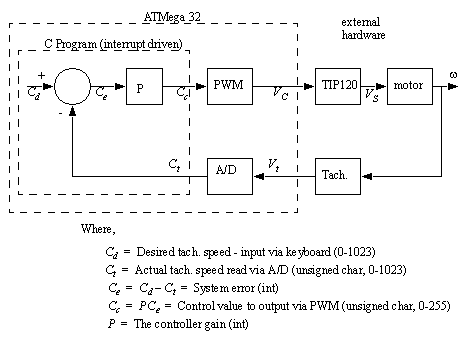
Figure 22.2 The complete feedback loop
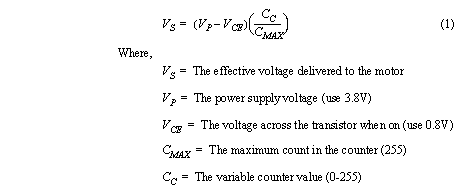
The PWM output to the motor is a square wave with a variable duty cycle. Equation (1) below shows how to convert the PWM value to an effective output voltage. It is worth noting that part of the voltage from the power supply is lost across the transistor, thus reducing the effective voltage to the motor.
To implement this controller we need a better program structure than was used before. This is shown in the following program listing. The IO_update() function will be called many times per second by an interrupt subroutine. The CLK_setup function initializes the interrupt routines in the processor so that the ’SIGNAL(SIG_OVERFLOW1)’function will be called once evey 10ms. This in turn will call the IO_update() function. The main program sets up the various input output devices and then begins a loop where it deals with keyboard IO. Notice that the subroutines to update the inputs and outputs do not appear in the main program loop. It communicates with those routines by changing the value of the global variable ’count’.


One major challenge when constructing a system is debugging. The flowchart in Figure 22.3 The Traditional Debugging Approach shows the tradition approach to debugging.
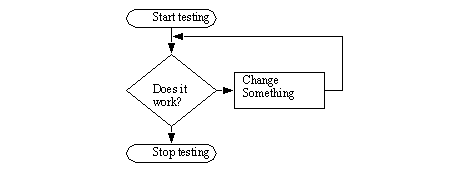
Figure 22.3 The Traditional Debugging Approach
While this debugging approach is easy to understand it takes much longer to solve problems and can become very frustrating. The debugging approach shown in Figure 22.4 Enlightened Debugging Approach is much more mature. Although it involves a few more steps, it will often take substantially less time. The essence of this method is that the program is not changed until the source of the problem in known. Common methods are to use print statements, or other debugging tools to see what the program is doing.
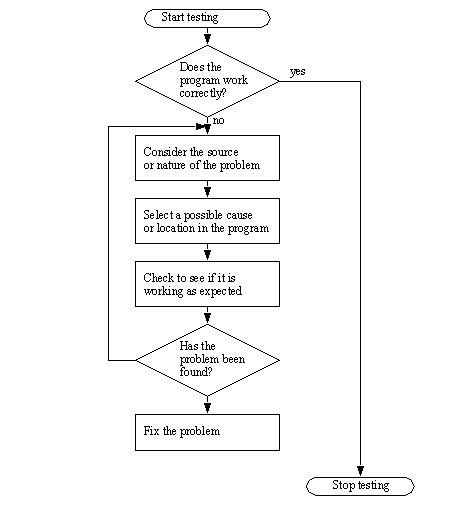
Figure 22.4 Enlightened Debugging Approach
1. Review the programs from the previous lab.
2. Write a program that will allow keyboard commands to change the PWM, and output the analog input to the screen once a second. Please note that this may be noisy and using the average of multiple readings may be required to reduce the noise.
3. Write a program that implements the feedback controller described in the background section. Put the feedback loop in an interrupt subroutine, and use the main program for keyboard IO. Don’t forget to consider the number limitation of the chosen datatypes. (i.e., 2’s compliment integers)
computer with an atmega32 compiler
TIP 120/122 Darlington NPN transistor
heatsink for TIP 120/122 transistor
1. Build the motor speed controller pictured in Figure 22.5 PWM control of motor speed. Use Figure 22.6 TIP 120/122 NPN Darlington pair transistor when connecting the transistor. (Note: if the transistor gets hot during operation use a heat sink on the transistor to help dissipate heat). Use the PWM program from the previous lab to control the PWM output and test the motor speed control.
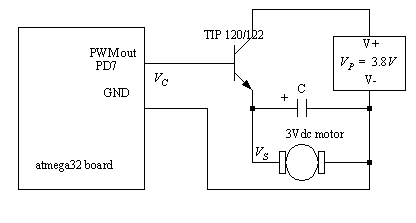
Figure 22.5 PWM control of motor speed
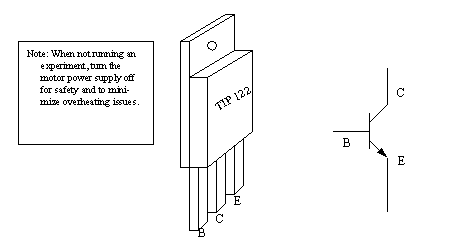
Figure 22.6 TIP 120/122 NPN Darlington pair transistor
2. Use a second motor as the tachometer (not to be confused with the strobe tachometer, used for calibration). This is done by connecting the motor shafts using a light colored piece of tape. It is also advisable to fix both motors to a common base to reduce vibrations. DO NOT CONNECT THE TACHOMETER LEADS TO THE ANALOG INPUT YET.
3. Label both leads of the motor V+ and V-. Connect these leads to a DMM. Connect the V+ lead to the positive input on the DMM, and V- to the common/ground on the DMM.
4. Use the program developed for the prelab to vary the PWM output to control the motor speed. Take the following readings in a tabular form. The motor RPM can be measured using the strobe tachometer as a reference. Vt is measured from the motor tachometer using the DMM, and a second DMM is used to measure Vs. The table should have at least 5 points spanning the range. (Note: if there is excessive vibration correct it before taking readings.)

5. If the voltages for Vt were negative swap the V+ and V- labels on the motor tachometer. FAILURE TO DO THIS MAY DAMAGE YOUR EQUIPMENT. Connect the motor tachometer to the analog input as shown in Figure 22.7 Motor tachometer analog input. You may also change the signs for Vt in the table.

Figure 22.7 Motor tachometer analog input
6. Use the prelab program to vary the PWM output and read the resulting analog input. Add the values to the previous table.
7. Enter and test the feedback control program developed in the prelab with a gain of P=2. Change the setpoint, Cd, to different values and measure the resulting speed, Ct. Record these values in a new table.
8. Repeat the previous step twice for gains of P=1 and P=4.
9. Graph the results from the three tests on a single graph.