
|
|
|
4.5 OPERATING CHARACTERISTIC (OC) CURVES
������������Used to estimate the probability of lot rejection, and design sampling plans.
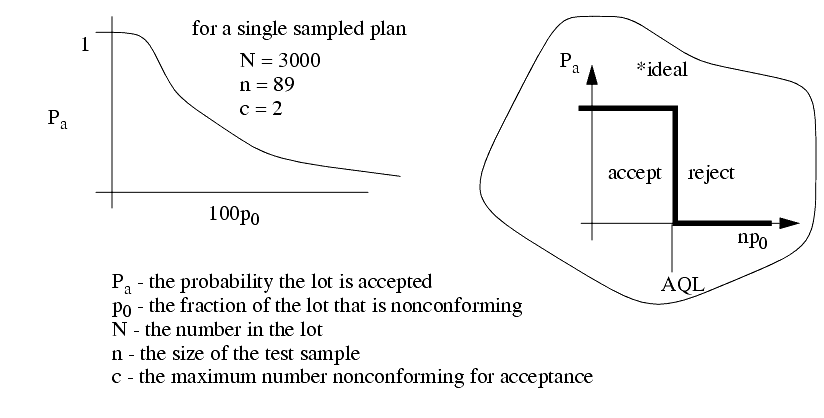
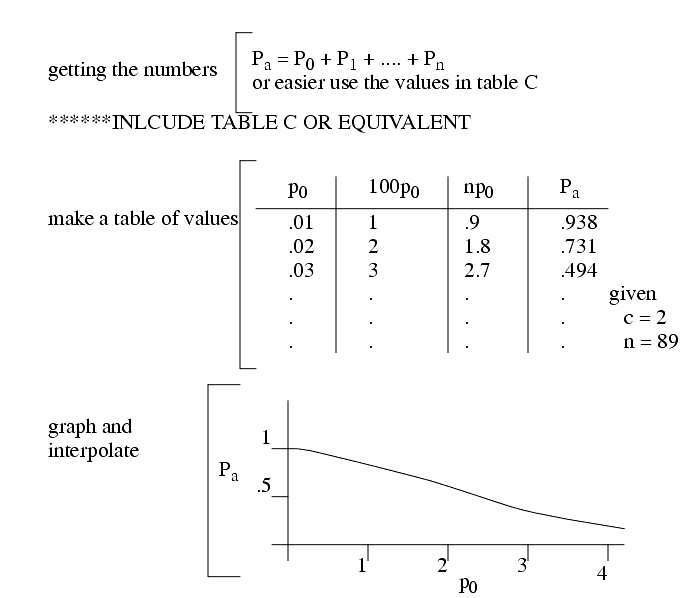
Drawing the single sampling curve (assuming Poisson distribution)
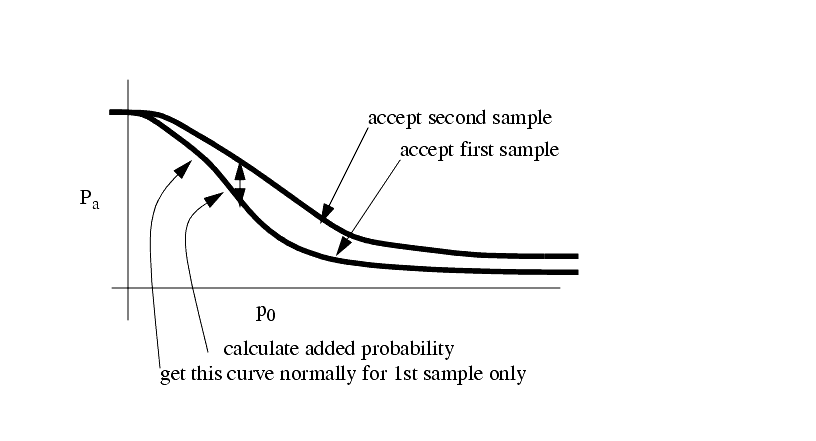
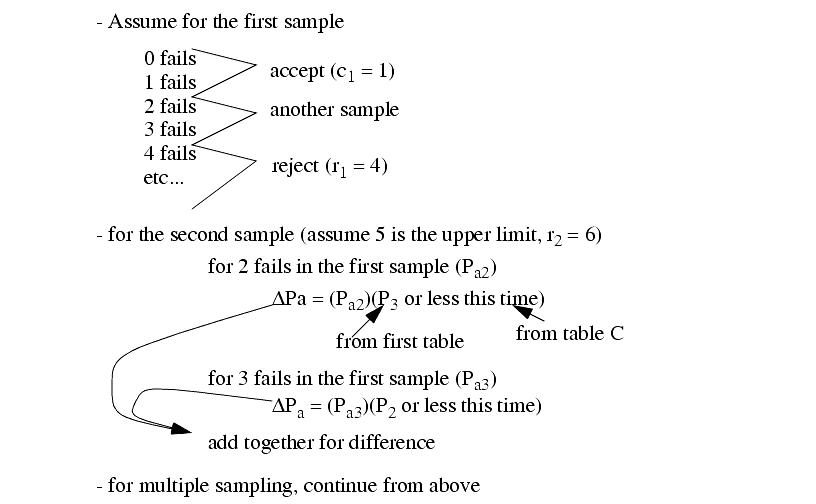
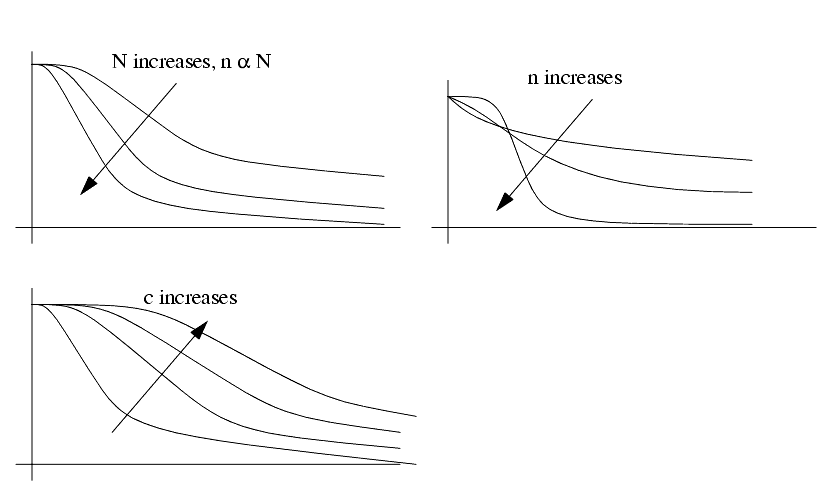
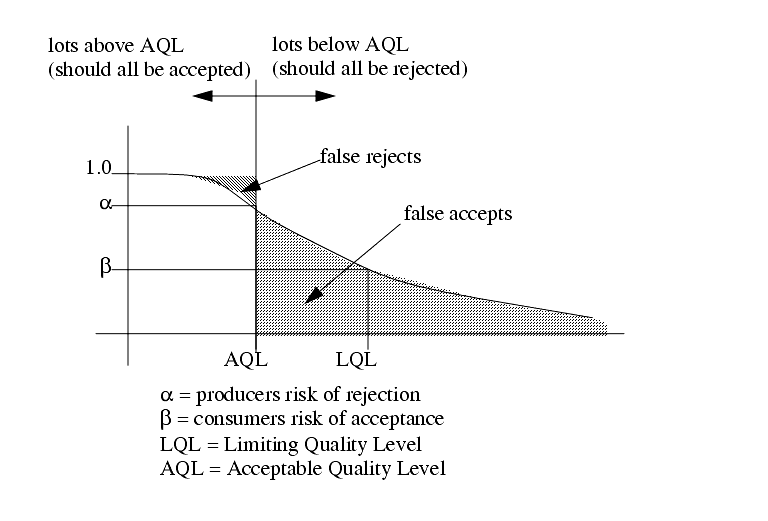
The basic trade-off to be considered when designing sampling plans.
- The producer does not want to have lots with higher rejects than the AQL to be rejected. Typically lots have acceptance levels at 95% when at AQL. This gives a producers risk of a = 100% - 95% = 5%. In real terms this means if products are near the AQL, they have a 5% chance of being rejected even though they are acceptable.
- The consumer/customer does not want to accept clearly unacceptable parts. If the quality is beyond a second unacceptable limit, the LQL (Lower Quality Level) they will typically be accepted 10% of the time, giving a consumers risk of b = 10%. This limit is also known as the LTPD (Lot Tolerance Percent Defective) or RQL (Rejectable Quality Level).
AOQ (Average Outgoing Quality)
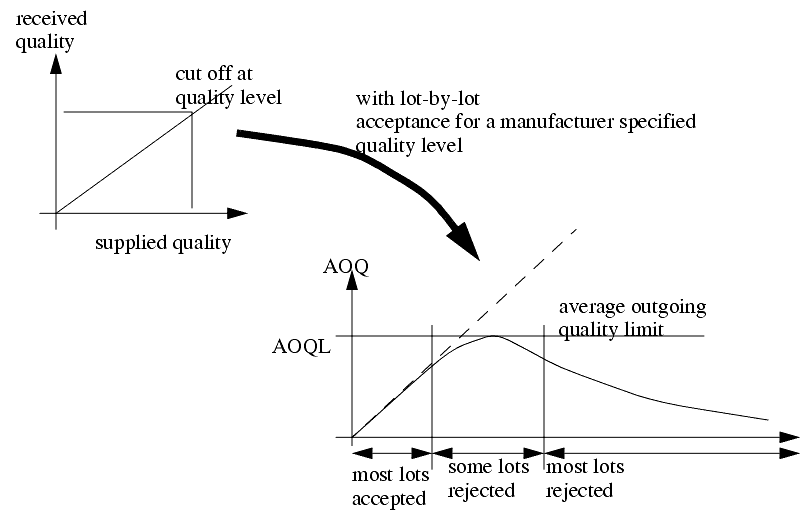
AOQ (Average Outgoing Quality) - a simple relationship between quality shipped and quality accepted.

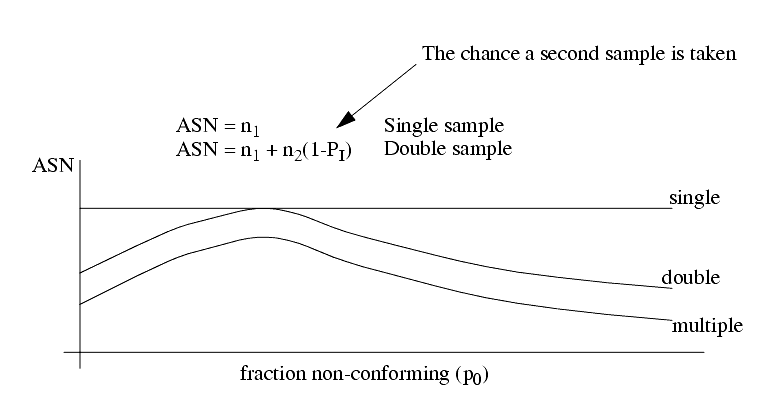
ASN (Average Sample Number) - the number of samples the receiver has to do
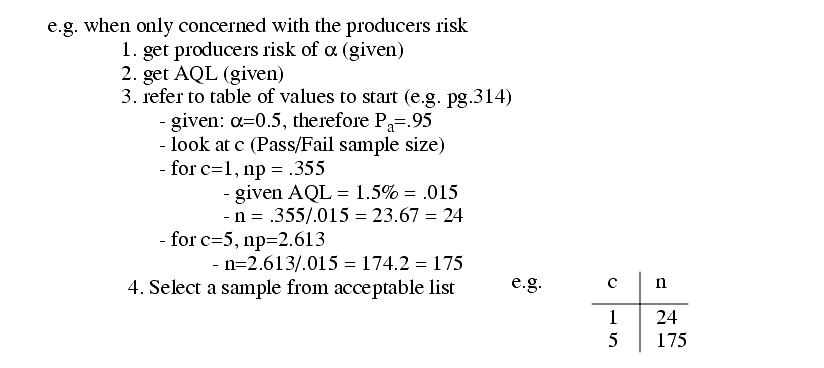
On the other hand, given consumers risk (b) and Lower Quality Level (LQL), we can follow a similar approach, still using the table on pg. 314
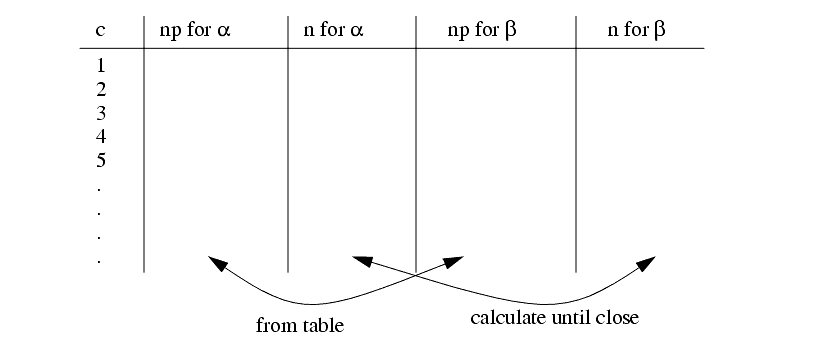
Given a and AQL, and b and LQL we can also find a best fit plan through trial and error.
READING: chapter 8, pg. 283-320
PROBLEMS: pg. 321- #1, 4, 7, 14, 17, 22
4.5.1 Practice Problems
������������1. Show the effect of lot screening if the sample size is n=100 and the reject limit is c=1.
3. a) Develop Operating Characteristic (OC) curves for the three cases below,
b) For each curve indicate the AQL and RQL for a producer risk of 5% and a consumer risk of 10%
(ans. for n=20,c=4, AQL=10%, RQL=40%, for n=40,c=8, AQL=11.8%,RQL=33%, for n=80,c=16, AQL=13.8%,RQL=N.A.)
Search for More: |

Custom Search
|

|