4.10 ANSWERS TO SELECTED PROBLEMS:
������������
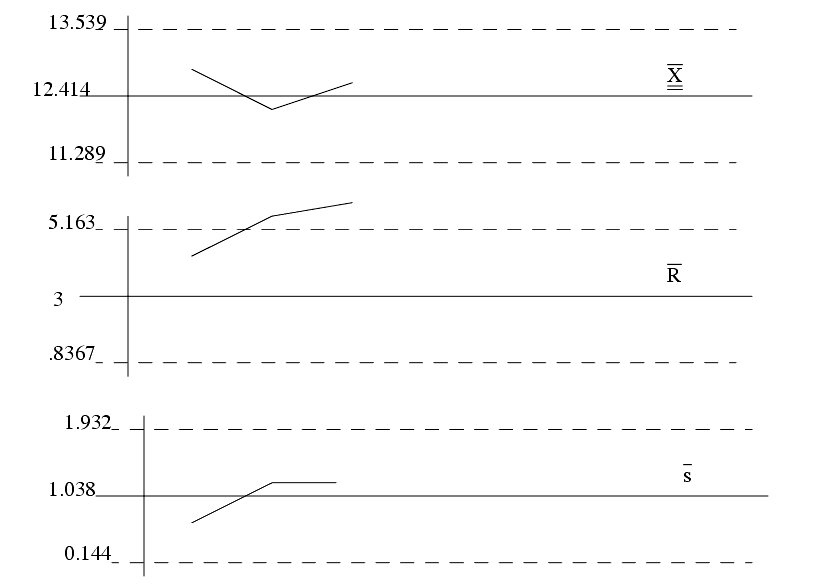
1.
Based on exact calculations
Approximate control limits
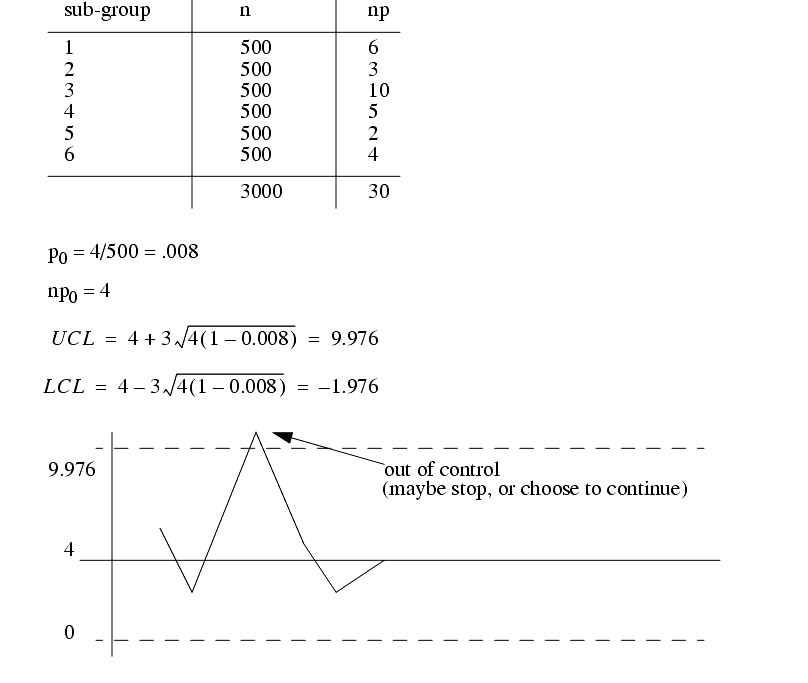
2. We have nonconforming units with a constant sample size, therefore select an np chart.
3. Short answers
a) The histogram on the left indicates grouped data, the histogram on the right indicates ungrouped data.
b) Bimodal distributions indicate a mixture of two sample populations, as if a box of parts has been filled by two different machines.
c) Cp indicates process variance to tolerance only, while Cpk incorporates the shift of the process centre also.
d) DOE allows the most sensitive process parameters to be controlled first.
e) Double sampled plans are good when we have something like a good supplier, and destructive testing. Single sampled plans are better when quality must be very high.
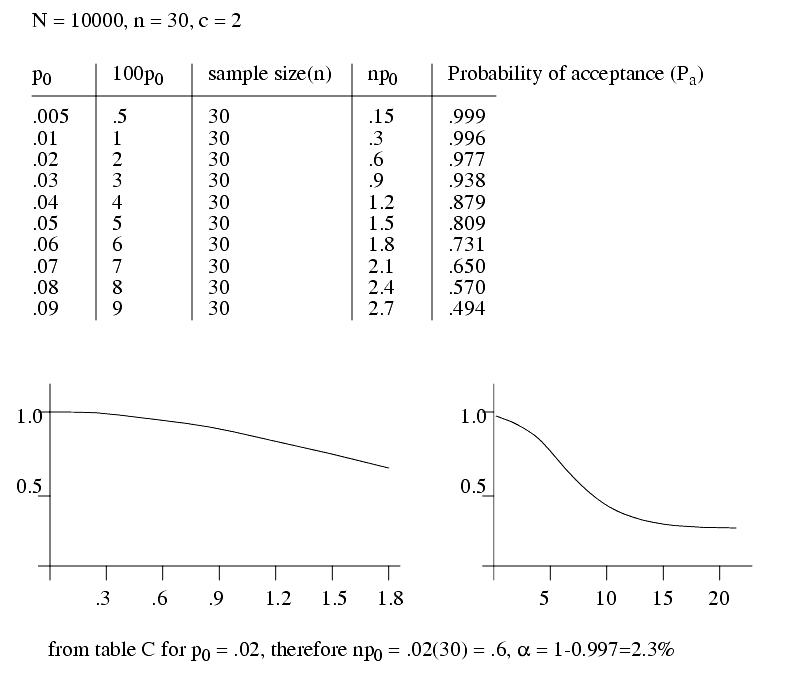
f) Look at charts in book. sample = 188, 2 or less must fail for acceptance.
5.
6.
a)
b)
c)
7. Short answer questions
a) Ungrouped data is continuous, and can be grouped into "slots"
b) It is a value in a set of grouped data that reoccurs the most. It tends to indicate where a distribution is centred, or some unnatural patterns. e.g., 10 out of 30 students get a mark of 85% on the test, indicating copying.
c) A set of samples are taken from a process in one instant in time. The samples are all from a very short period of production time.
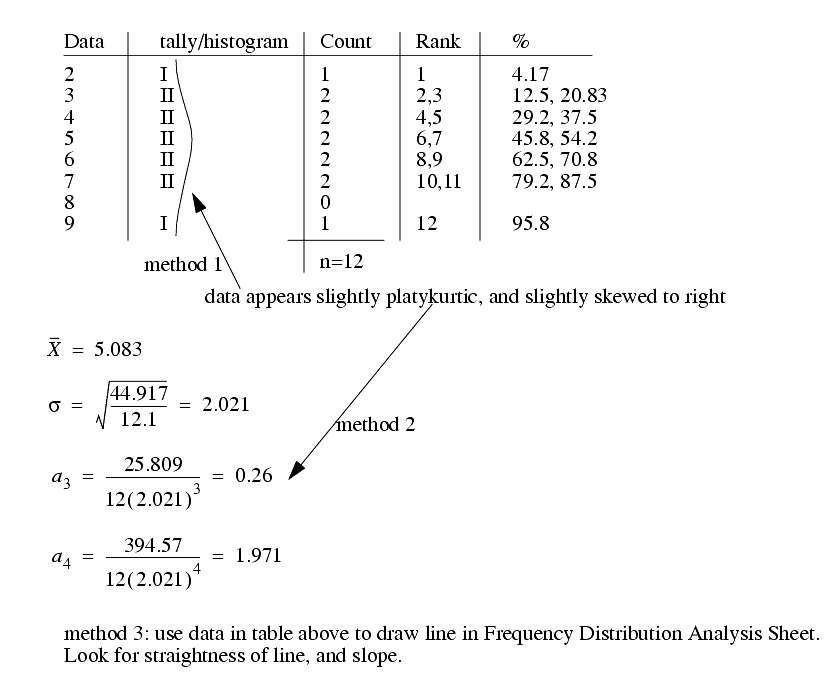
8. May as well use a3 and a4, but other methods could be used. X = 148.3125, s = 9.0459, a3 = .3900 (skewed to right, positive direction), a4 = 1.958 indicates mesokurtic.
9.