4.7 ANSERED QUESTIONS
������������
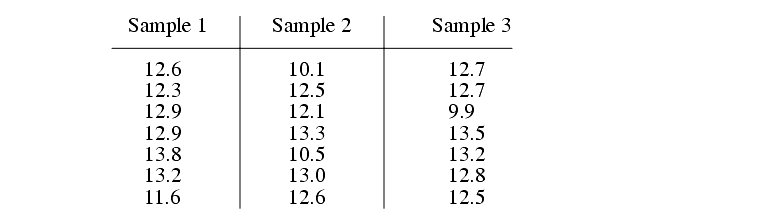
#1 Draw the X, R, and s charts for the data below, using exact calculations: Then calculate the Control Limits using approximate techniques.
#2 The data below was collected for a factory that manufactures telephones. Each day they make 10,000 phones, inspect 500, and expect to find 4 nonconforming (e.g. sometimes a button is put in upside down). The chart below lists nonconformity data for the previous week. Select the appropriate type of control chart, and plot the data.
#3 Use a Frequency Division Analysis Sheet and 2 other methods to determine if the data listed below is normal.
5, 7, 4, 3, 5, 9, 6, 4, 6, 7, 2, 3
#4 Very Short answers
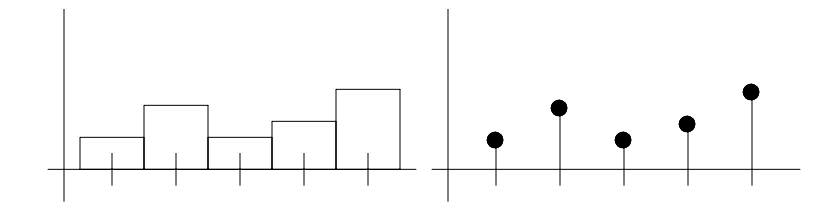
a) what is the difference between the two histograms below?
b) Give a practical example of what a bi-modal distribution would indicate in quality control.
c) Describe the difference between Cp and Cpk.
d) How can Design of Experiments help an engineer improve a process?
e) Why would a single sampled plan be preferred to a double sampled Lot Acceptance Plan. Use an example in your answer.
f) Give a single sampling plan for a sample of 188 with an Acceptance Quality Level (AQL) of 0.4.
#5 Draw the Operating Characteristic (OC) curve for a batch of 10,000 with a sample size of 30, and a non-conforming reject level of 2. Identify the producers risk when a quality of 2% nonconforming is produced.
#6
a) Develop an Ishikawa diagram to identify problems when painting a house.
b) make a tally sheet based on your Ishikawa diagram, and suggest some data.
c) Draw a Pareto chart of the data.
#7 Short Answer Questions
a) What is meant by grouped and ungrouped data?
b) What is a mode? Give an example.
c) Describe the Instant Time Method
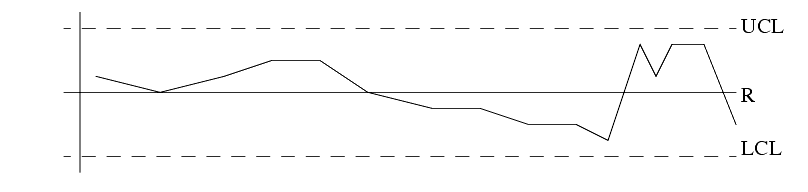
d) What problems can be seen in this control chart?
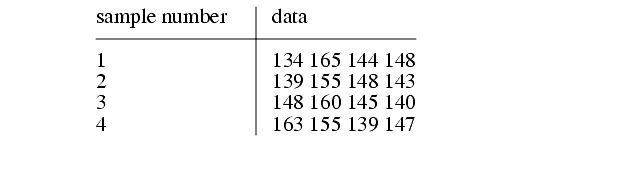
#8 Is this data normal?
#9 For the data in question #8 draw an X and R chart