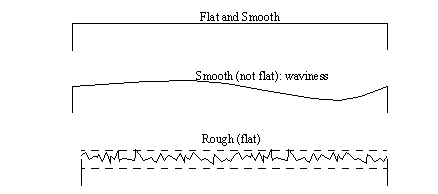
• No surface is perfectly smooth, but the better the surface quality, the longer a product generally lasts, and the better is performs.
• Surface texture can be difficult to analyze quantitatively. Two surfaces may be entirely different, yet still provide the same CLA (Ra) value.
• Recent developments in production technique, and metrology equipment have made it possible to specify and measure surface quality.
• There are standards, such as the CSA B95 1962.
• Surface Quality can be important when dealing with,
lubrication: small indentations can hold lubricant
resistant to wear: smoother surfaces wear less
tool life: rough surfaces will correlate to shorter tool life
corrosion: smoother surfaces easier to clean, less surface area to erode
noise reduction: smooth surfaces make less noise when rubbing, for example meshing gears.
fit: pressure seals could leak through pits
• Surface geometry can be quantified a few different ways.

• Real surfaces are rarely so flat, or smooth, but most commonly a combination of the two.

• Some other terms of interest in surface measurement,
Surface texture: all of the details that make up a surface, including roughness, waviness, scratches, etc.
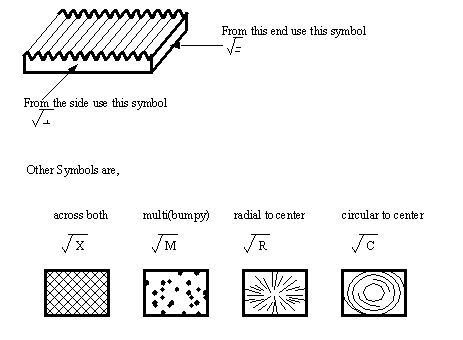
Lay: the direction of the roughness on a newly manufactured surface. The roughest profile will be perpendicular to the lay.
Flaws: small scratches, cracks, inclusions, etc.
Cutoff: a value selected to be less than the waviness, but greater than the roughness length. This is controlled using electrical or digital filters. Typical values might be; 0.010”, 0.030”, 0.100”
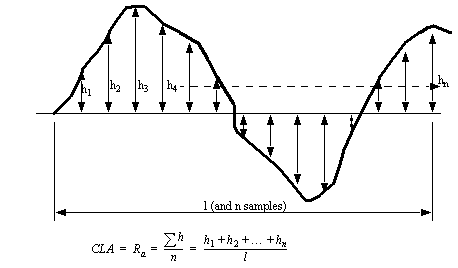
• A simple measure of roughness is the average area per unit length that is off the center line (mean). We will call this the Center Line Average (CLA), or Arithmetic Average (Ra), the units are μinches.
• To calculate the roughness using samples at evenly spaced positions,
• The roughness can also be calculated by area,
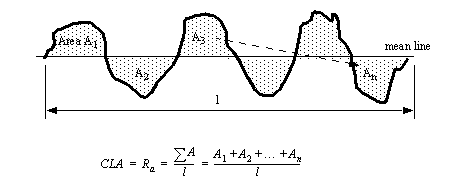
• In both cases the mean line is located so the sum of areas above the line is equal to the sum of areas bellow the line.
• As an example we can examine a surface that has a triangular profile,
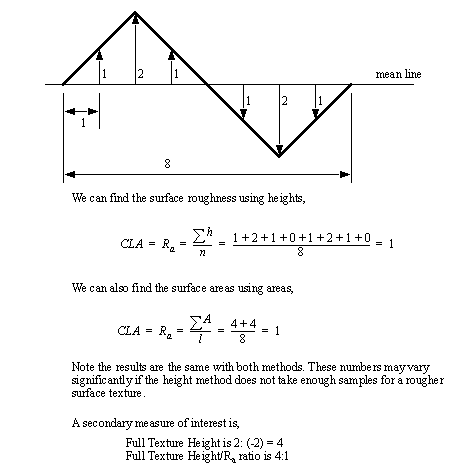
• One of the instruments that we will use is the Surfcom. If we were to have obtained the graph above from this device, we would have to use the following formula to determine the true values,

• There are a number of useful techniques for measuring surface roughness,
observation and touch: the human finger is very perceptive to surface roughness
stylus based equipment: very common
interferometry: uses light wave interference patterns (discussed later)
• Human perception is highly relative. In other words, without something to compare to, you will not be certain about what you are feeling.
• To give the human tester a reference for what they are touching, commercial sets of standards are available.
• Comparison should be made against matched identical processes.
• One method of note is the finger nail assessment of roughness and touch method used for draw dies in the auto industry.
• One example of this is the Brown & Sharpe Surfcom unit.
• Basically this technique uses a stylus that tracks small changes in surface height, and a skid that follows large changes in surface height. The use of the two together reduces the effects of non-flat surfaces on the surface roughness measurement. The relative motion between the skid and the stylus is measured with a magnetic circuit and induction coils.
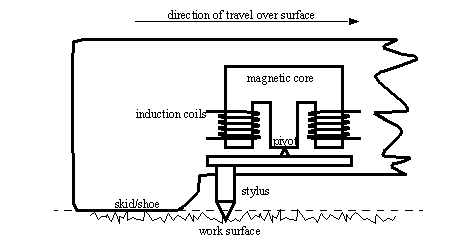
• The actual apparatus uses the apparatus hooked to other instrumentation. The induction coils drive amplifiers, and other signal conditioning hardware. The then amplified signal is used to drive a recorder that shows stylus position, and a digital readout that displays the CLA/Ra value.
• The paper chart that is recorded is magnified in height by 100000:1, and in length by 82:1 to make the scale suitable to the human eye.
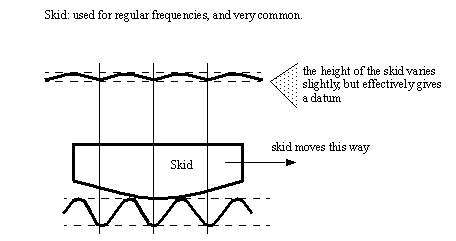
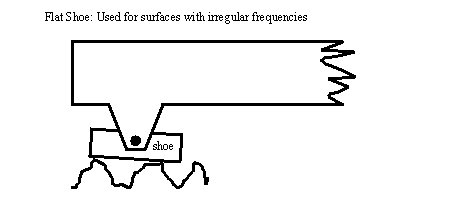
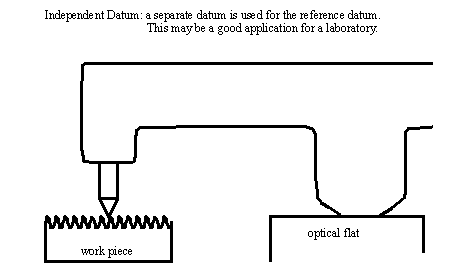
• The datum that the stylus position should be compared to can be one of three,
Skid: can be used for regular frequency roughness
Shoe: can be used for irregular frequency roughness
Independent: can use an optical flat
• Where the scan is stopped might influence the Ra value. This is especially true if the surface texture varies within a very small section of the surface. For example,
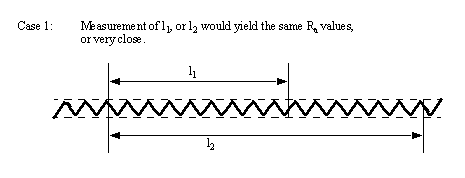
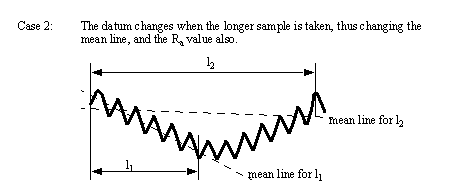
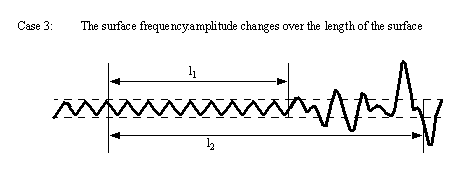
• In both cases 2 and 3 above, Ra would be higher over the longer sample (l2) than over the shorter sample (l1).
• The bearing surface that the skid/shoe runs on might also have an effected on the measurement.

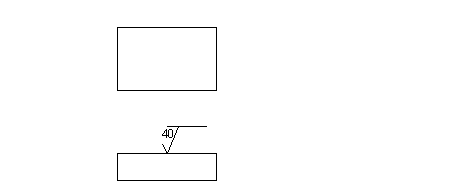
• The following specification symbol can be used on drawings to specify surface textures desired on a completed part,
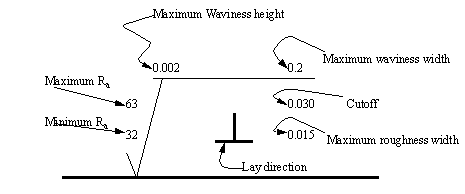
Waviness height: the distance from a peak to a valley
Waviness width: the distance between peaks or valleys
Roughness width cutoff: a value greater than the maximum roughness width that is the largest separation of surface irregularities included in the measurements. Typical values are (0.003”, 0.010”, 0.030”, 0.100”, 0.300”)
Lay: the direction the roughness pattern should follow
• The example below shows an upper limit of 40 micro in. roughness
• The symbol below can specify how the roughness is to lay,
• Standards CLA/Ra values used on drawings are: 1, 2, 4, 8, 16, 32, 63, 125, 250, 500 and 1000 μin.
• Stylus travel is perpendicular to the lay specified.
• These symbols can be related to the newer GD&T symbols
• The Root Means Squared (RMS) System (also known as Rq) is not commonly used in Canada,
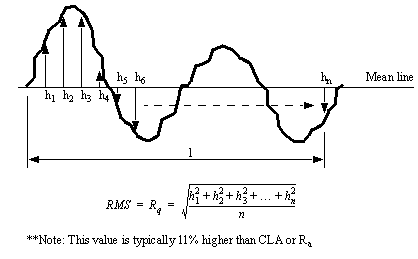
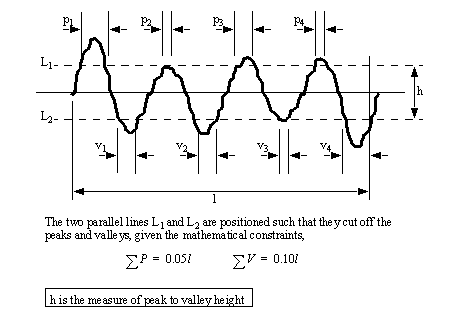
• The Peak to Valley method cuts the peaks off the wave, and then uses the band between to determine the roughness. This method is not commonly used in Canada.
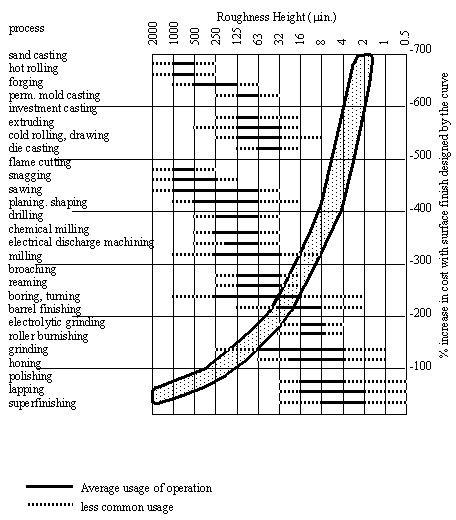
• A simple table that basically outlines the process capabilities of a number of processes is, [ANSI B46.1-1962]
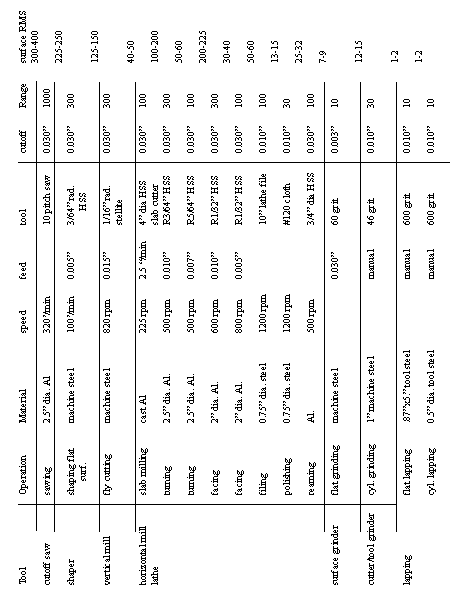
• A table of roughness measurements is given below [Krar],
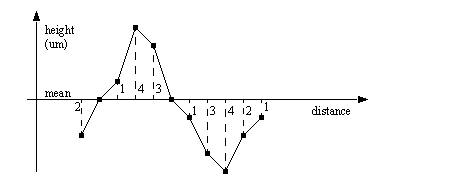
Problem 10.1 Calculate the CLA/Ra value for the wave form below.
Problem 10.4 What methods are used for measuring surface roughness?
Problem 10.6 Two different surfaces may have the same roughness value. Why?
Problem 10.7 What will be the effect of a difference between the stylus path and the surface roughness?
Problem 10.8 When is waviness a desirable and undesirable design feature?
Problem 10.9 Given the figure below indicating stylus height values for a surface roughness measurement, find the Ra and Rq value.

Problem 10.11 How are tolerances related to the size of a feature?