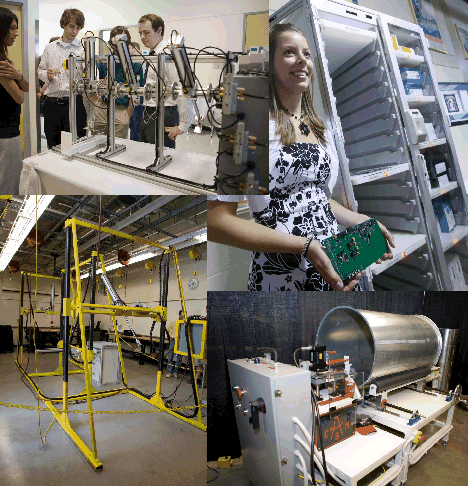
Jack, H., “A Risk Assessment Tool for Managing Student Design Projects”, ASEE Annual Meeting, Louisville, KY, June 2010.A Risk Assessment Tool For Managing Student Design Projects AbstractMany design projects done by undergraduate students carry a high degree of risk because of inexperience. In many cases students tend to ignore the risks and focus on the project elements that are the most familiar. To aid senior project students in this process the author has developed a method that is relatively objective and simple to apply. The outcome is an identified set of risks that student teams can use to prioritize issues and focus efforts. This is done by listing all major project concepts, components, methods, alternate approaches, and more. A ranking is then assigned based upon clear criteria. The designers must then justify a lower risk score. And, high risk elements are addressed first. Throughout the project students are expected to drive down the risk throughout the project until delivery, when the risk is negligible. IntroductionAt Grand Valley State University project work is integrated through the curriculum. Students begin with design-build projects in the freshman year. The complexity of the project work is increased until the senior project. The course projects are used to teach students the fundamentals of project management, and provide experience in free form decision making and project execution. The senior project experience is positioned as a finishing exercise before the students join industry. Senior projects involves the design and build of production equipment, test equipment, and new product designs for local companies. In 2009 the total materials costs were over $170,000 for 12 projects. These projects must meet industrial standards and require approval by the sponsor. And, while failure can be acceptable in course projects it is not permissible for the senior project. Given these requirements the projects are carefully selected and managed to ensure success1. Tools used include tracking tools for labor tasks, budget, Gantt charts, meeting minutes, weekly meetings, sign-offs on specifications, concepts, and detailed design proposals. In addition faculty expertise is used to guide the students. The composition of the project varies to meet the demands of the projects but typically teams have three to six members from all four disciplines; Computer, Electrical, Mechanical, and Product Design and Manufacturing Engineering. Examples of typical projects are shown in Figure 1. The students have had varying levels of exposure to the design process through undergraduate course projects. At best the students have done multiple projects with outside sponsors. As a minimum students have done a half dozen internal projects. In all cases the student are exposed to a process where they must do design work first. The designs are critically reviewed. Finally the students execute the design including fabrication, testing, and final delivery. The design process begins in the freshman year and by the freshman year they are being prepared for self guided project management work in industrial settings. 
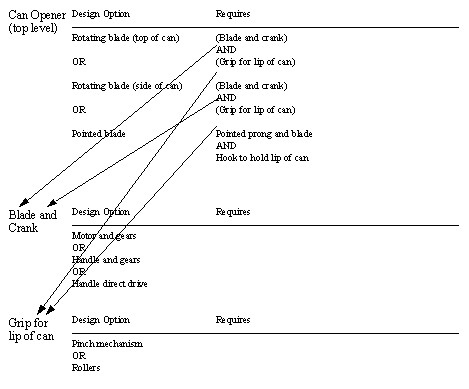
Figure 1: Production Equipment for a Manufacturer The current model for senior project has been used for 13 years. Over that time the complexity of the projects has increased as the faculty and curriculum have been refined. As part of that process the faculty have accumulated a wealth of knowledge about projects in general. Every project has problems, but some more than others. There are many lessoned to be learned by the failures. The work in this paper reflects the wealth of knowledge from project experiences. To state the obvious, designers count on experience to make good decisions. This experience is obtained by making decisions and seeing the outcomes. Good outcomes reinforce the correctness of decisions, errors provide ‘opportunities for change’. Based on the authors experience, some examples of experiential knowledge are listed below. Parts are often not in stock, or take longer to deliver than promised. Rushing past simple design details, and taking shortcuts, often leads to time consuming problems. Debugging always takes longer than expected. Things that are ‘left for later’ never get easier or go away by themselves. Extra time spent on design saves even more on debugging. Unproven technologies often hold promise, but can be very difficult to use. If you want to do something the time and cost estimates will be low. If you don’t want to do something they will be high. The not invented here syndrome leads to extra work. For everything you decide to do, there is something else you must stop doing. The simplest design that meets the objectives is the best: if it works. Sometimes components do not do everything the sales literature says. Things are normally more difficulty than they look. Student ownership of ideas can blind then to reason. In an industrial setting designers are often guided by a corporate knowledge of the design process, and knowledge of similar designs. On the other hand entrepreneurial designers, and students, are often approaching a new design with little history or experience to depend on. Other challenges that face the new designs is separating emotional attachments to the work from objective decision making. Hence design tools like decision matrices are highly susceptible to manipulation of scores and weights to obtain desired solutions. There are multiple ways to do design work. A simplistic model is shown below for the purposes of discussion. Steps i), iii), and v) involve some maturity. Inexperienced designed will typically rush these decision stages based upon personal opinions or perceptions. i) Identify a design issue or problem v) Evaluate the design (build, testing, etc.) vi) Go back and repeat until the design is good A common academic approach to design work is the use of brainstorming to generate concepts (step ii), followed by the Pugh method to select a design concept. In the authors experience students will often generate a reasonable set of concepts. After the brainstorming session they often select a concept that they ‘feel’ or ‘believe’ will solve the problem. Then a method such as the Pugh decision matrix is then used to justify the solution. However the selection of weighting values or assignment is often manipulated until it justifies the selected solution. An example is that a change in cost from $90 to $100 dollars changes a cost ‘value’ from 0.1 / 1.0 to 0.9 / 1.0. Although somewhat indirect, the author wishes to emphasize that impartial decision making is important to making good design decisions. At first glance the author appears to make a case for one optimal design solution. A practical designer, or manager, or business may opt for a sub-optimal design for a variety of reasons. For example if a designer picks something that is sub-optimal, but they have a high degree of comfort, the design work may be more successful. Or a less optional design may be selected for marketing demands, sometimes irrational. But the major point to consider is that the illusion of an optimal design is weak at best. The process of design can be very messy, but a few rules of thumb can be very beneficial. A design methodology that oversimplifies the design process, but is very useful to guide designers is the DFA (Design For Assembly) method2. Simple rules are used to assign assembly times for assemblies. With these a designer can estimate assembly time, and look for opportunities for improvement. The scoring system also suggests a variety of design opportunities to reduce the complexity and cost of an assembly. The designs developed with these methods are not perfect, but they are often made better. With the same philosophy the author has developed a set of tools to help students identify high risk design elements so that they may make better design decisions, use their time more effectively, and improve the chance of project success. Ranking Decisions: Design RiskAll decisions are made with the intention of moving a project forward towards some stated goals. Bad decisions typically involve added risk and uncertainty. These added risks do not always translate to the failure of a design project, but they do increase the likelihood of failure (qualitatively and quantitatively). In a very crude sense design options can be rated with the following scale. A score of 5 is a very high risk, something to be avoided. A risk of 0 corresponds to complete assurance, typically project completion. 0 Established Technology: components can be purchased and have been available for years from well established suppliers. 0 Established Design: The design is a standard type, very similar to another done before. 1 Standard Design: a standard system or component design that has been designed and documented before, but not by the team. 2 New Technology: components have been available for less than two years or from single source/unknown suppliers. 3 Prototype only: the system has been proven with a limited prototype, but has not been fully implemented. 4 New Design: the design includes theoretical physics, new algorithm, etc. 4 Technology Limited: The design can only be accomplished with one approach. 5 Research: The design depends upon major questions or knowledge that has to be researched At the beginning of any project the risk will be highest at the beginning and be reduced as the design work proceeds. In a corporate design the overall risk might start near a 2 on this scale, while an entrepreneurial design may start in the 4-5 range. A wise designer will try to drive the design down to a risk level of a score of 1-2 before committing substantial resources to the project. If a design has multiple parts the worst score for any part may be the overall score for the project. This risk can be reduced by having alternates with equal risk factors. When students originally approach a project they should be encouraged to set specifications, select design concepts, build prototypes, and make decisions to drive the risk to a score of 2 before moving to detailed design. And naturally when they are deciding what is important, it is the critical design with the highest score. But of course a design with alternates (backup plans) takes the lower risk. And multiple lower risk scores statistically reduce the overall probability of failure. Purchasing RiskPurchasing parts is a useful strategy to reduce the dependence on internal resources while allowing a manufacturer to focus on their core business strengths. But any part purchased outside, or produced internally carries some element of risk. The ranking system below provides a quick way to apply a score to each part in the design. Obviously the scoring should focus on special parts in the design. It would be wise to ignore commodity parts such as surface mount discrete components, nuts/bolts/washers, generic raw materials, etc. 1 Commodity item: available now 2 Commodity item: back-ordered 3 Standard item: special order 4 Special Item: requires supplier design These rules are often learned from horror stories about part identification and purchasing. Many students have ordered a standard item such as an integrated circuit, motor, or gear set, only to find that these are out of stock or back ordered. Even items that are available can be lost in shipping. Rare items are a terrible part to include in any design. Cost RiskSmall decisions can have a huge impact on final design cost. As the design progresses these values drop. In many ways these correlate to the design risk, but are more relaxed. In very simple terms the cost of the project can vary when the design does, risk is a good indicator of how much the design may change. 0 Complete: the design work is already complete for a similar design done by the team. 1 Standard: the design is based on a well understood design. 2 Common: the design has been done before by others, but few details are available. 4 New: the design requires elements that have not been executed before. 5 Rough Concept: The design has been imagined but not fully detailed. It is unlikely that a designer will pay much attention to this metric unless they are cost constrained. However they should be aware that a manager or project sponsor will weigh decisions to kill projects using this scale. Projects will be halted if the design exceeds, or has a real chance of exceeding the budget. And then time and effort will be directed to projects that have a greater change of providing a dependable Return on Investment (ROI). Modeling DecisionsThe nature of a design is that it is a collection of decisions. These choices can be high or low level, but they are all coupled. A simple example of a can opener design is shown in Figure 2. Three common designs are detailed, first a rotating blade that cuts on the flat top of the can. A second option is a rotating blade that cuts beside the lid on the outer cylinder of the can. The third option is a tool that pierces the flat top of the can and then uses a prying motion to cut the lid. For each of these design choices there are related sub decisions. In the simplest case (the pointed blade) the design subcomponents are listed, but no sub components are given. The two rotating blade designs need a mechanism to drive the blade, and a second mechanism to move the blade in or out of contact with the can. Parenthesis are used to indicate required parts that are expanded farther, in this case ‘Blade and crank’ and ‘Grip for lip of can’. These two choices are relatively similar so they are reused instead of creating redundant components. Practically the motor and gears should be expanded, but is not in this example for brevity. In the tables there are a few items that are both required, these are marked with AND. In other cases choices are available, alternates are marked with ORs. It goes without saying that alternates (ORs) are good to have in any design as a fail-safe or backup. The decision to stop is somewhat arbitrary: a good rule of thumb is that you can stop at purchased components, or parts you can already make. Anything that is unknown should be expanded. The process to create the design tables is, 1. Identify critical choices in the design. These are normally high level strategic, or low level decisions that are technology limited. Each of these will be a table. 2. Begin to add design choices to the tables. If there are low level tables (technology limited), they should eventually link to the upper level choices. 3. Look at the table to find places without alternates: unless they are very low risk alternates should be added. 4. Look for low level tables that are still vague or require more detail. Are the lowest level options something that can be purchased, or is already made in-house? 
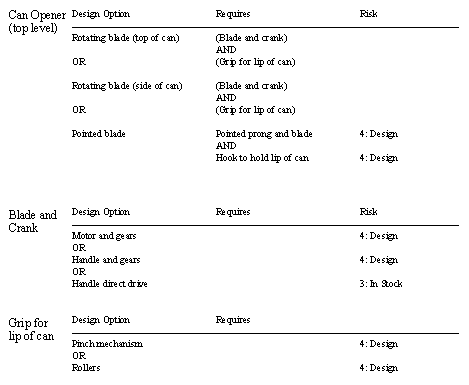
Figure 2: A Model of Design Decisions These tables can be captured in a spreadsheet, or drawn as a tree. This is very helpful in the next stage when risks are considered. Evaluating A Design StateThe basic 0 to 5 scores discussed before can be used to assign risks to the lowest levels of the design. These can then be combined from the lowest levels to the highest to calculate overall design scores. The first step is shown in Figure 3. Here the risks are shown as if each part or component is purchased. In all of the cases some design work is required so the purchase risk score is 4 for all. But we will assume that the direct drive handle is a commonly produced inhouse part and so the risk score is 3. If some of the components were available for purchase, or in stock already, the score would drop. In the cases where there is a sub-assembly no risk is assigned yet. 
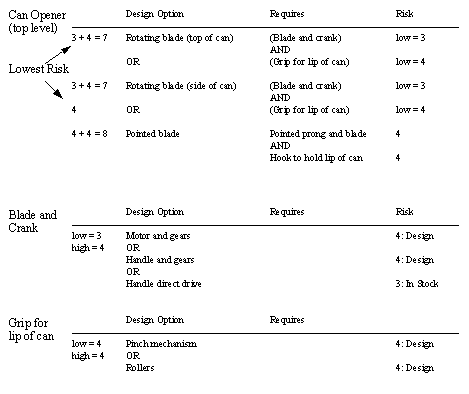
Figure 3: Risks Assigned to Lowest Level Decisions The overall design scores can be calculated by starting at the low level and working upwards. When parts are both required (AND) the scores are added. For a lowest risk case the lowest score is picked at each level and then combined up to the highest level of the tables. In this case the three options result in risks of 7, 7, and 8. In this case the two first options are less risky because the ‘Blade and crank’ are in stock and don’t require any special design. Even if this design is not chosen, it sets a benchmark for risk that other designs can be compared to for relative risk. 
Figure 4: Risks are Summed for Higher Level Decisions In summary the process uses the following steps to find the least risky design, or the benchmark for design risk. If another design is picked the risk scores are selected by design choices, not by the lowest risk. 1. For each of the lowest levels in the decision tables risks are assigned as if the parts are purchased. 2. The risks are propagated up the tables to the highest levels. When there are ORs the lowest scores are picked for the least risky design. When there are ANDs the risks are added. 3. At the highest level pick the design with the lowest score. In the conceptual stage of the design it is acceptable (but not desirable) to have scores of 4 or 5, but the objective of the design work is to reduce it to a 3 before moving to detailed design. In detailed design the options should be reduced to a 2, and eventually a 1 or 0. Setting Priorities and Making Decisions Using RiskThe value of this tool is to drive the decision making process. Some of the key strategies are outlined below. Develop Alternatives: When risks are high (say a 3, 4, or 5) then alternates should be developed. If two alternative design options have a 50% chance of failure, they will have a 25% chance of failure when combined. Develop Prototypes: A design risk of 4 or 5 can be reduced to a 3 if a prototype is produced. Refining the prototype can reduce the risk to a 2. Purchase Development Kits or Samples: When a purchasing risk is high, or a design risk is high for purchased components it can be helpful to purchase developments kits, samples for testing, obtain design notes, or study existing applications. Benchmarking: High Cost and Design risks can be reduced by benchmarking. For example, if a similar design can be purchased for $50, then the final production cost can be crudely estimated. Taking the design apart and doing analysis can provide a basis for estimating design issues and solutions. Consulting: Unknown factors are part of overall risk. The strategic use of consultants and research can reveal unknown factors and reduce the risk for design, purchasing, and cost. Focus on the Highest Risks First: I hate to say it but the ideal design project should be boring. A directed strategy of dealing with the highest risk factors first is critical. Unresolved risks can lead to failures later when substantial time and resources have been committed. It is better to identify bad decisions early in the design process. Impact on Student Design ProjectsA formal evaluation is planned for the 2011 project cycle. At the time of writing the method is in the first wide-scale use in the senior project course that runs January to August 2010. Anecdotal observations are listed below. In the past students would leave major design decisions to the third or fourth month of the project. These decisions are typically being made a month earlier now. There has been a more orderly progression of design decisions from big picture to details than in the past. The projects have been able to deal with more free-form decision making. This has always been a problem with projects that have a ‘research’ component. The method provides a usable framework for discussions between faculty and student teams. Other decision making solutions provide a wide range of subjective decisions. In the past the use of Pugh design methods resulted in some truly absurd weighting based upon student preferences. This method is still subject to some manipulation, but much less than before. ConclusionsThe method described in this paper was used for the first time in the 2009 senior project at Grand Valley State University3. In 2008, before the introduction of the method, 6 of 13 senior projects were past the completion date by as much as 6 months because of various design issues related to the risk scores outlined. After the introduction of the method only 2 of 12 projects were past due for a month for minor issues. The method is currently being used in the 2010 senior projects. Overall the technique is very valuable early in the design process. Students are able to identify issues and deal with them first. In the conceptual stage of the design students build prototypes and selected components to lower risk factors for design components. During the detailed design phase there were few problems and calls for major redesigns. References1.Jack, H., "A Web Based Approach to Senior Project Management", ASEE Annual Conference, Austin, TX, June 14-17, 2009. 2. Boothroyd, D. “Assembly Automation and Product Design (Manufacturing Engineering and Materials Processing)”, Marcel Dekker, 1991. 3. Jack, H, “Senior Projects: Grand Valley State University School of Engineering”, http://sites.google.com/site/gvsuseniorprojects/. |