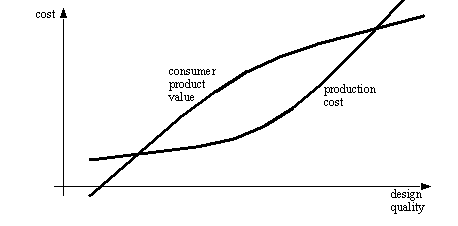
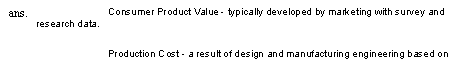
1. The graph below shows two curves that relate the cost of a product to the expected value.
a) What are the sources for the two curves on this graph?
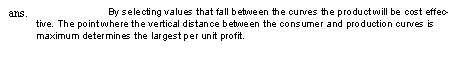
b) How can this graph be used when setting engineering specifications?