CONTROL OF CONTINUOUS ACTUATOR SYSTEMS24.2.1 Block DiagramsFigure 24.1 A Block Diagram shows a simple block diagram for controlling arm position. The system setpoint, or input, is the desired position for the arm. The arm position is expressed with the joint angles. The input enters a summation block, shown as a circle, where the actual joint angles are subtracted from the desired joint angles. The resulting difference is called the error. The error is transformed to joint torques by the first block labeled neural system and muscles. The next block, arm structure and dynamics, converts the torques to new arm positions. The new arm positions are converted back to joint angles by the eyes. 
The blocks in block diagrams represent real systems that have inputs and outputs. The inputs and outputs can be real quantities, such as fluid flow rates, voltages, or pressures. The inputs and outputs can also be calculated as values in computer programs. In continuous systems the blocks can be described using differential equations. Laplace transforms and transfer functions are often used for linear systems. 24.2.2 Feedback Control SystemsAs introduced in the previous section, feedback control systems compare the desired and actual outputs to find a system error. A controller can use the error to drive an actuator to minimize the error. When a system uses the output value for control, it is called a feedback control system. When the feedback is subtracted from the input, the system has negative feedback. A negative feedback system is desirable because it is generally more stable, and will reduce system errors. Systems without feedback are less accurate and may become unstable. A car is shown in Figure 24.1 Addition of a Control System to a Car, without and with a velocity control system. First, consider the car by itself, the control variable is the gas pedal angle. The output is the velocity of the car. The negative feedback controller is shown inside the dashed line. Normally the driver will act as the control system, adjusting the speed to get a desired velocity. But, most automobile manufacturers offer cruise control systems that will automatically control the speed of the system. The driver will activate the system and set the desired velocity for the cruise controller with buttons. When running, the cruise control system will observe the velocity, determine the speed error, and then adjust the gas pedal angle to increase or decrease the velocity. 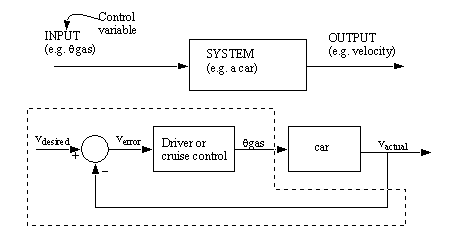
Figure 24.1 Addition of a Control System to a Car The control system must perform some type of calculation with Verror, to select a new θgas. This can be implemented with mechanical mechanisms, electronics, or software. Figure 24.1 Human Control Rules for Car Speed lists a number of rules that a person would use when acting as the controller. The driver will have some target velocity (that will occasionally be based on speed limits). The driver will then compare the target velocity to the actual velocity, and determine the difference between the target and actual. This difference is then used to adjust the gas pedal angle. 
Figure 24.1 Human Control Rules for Car Speed Mathematical rules are required when developing an automatic controller. The next two sections describe different approaches to controller design. 24.2.3 Proportional ControllersFigure 24.1 A Servomotor Feedback Controller shows a block diagram for a common servo motor controlled positioning system. The input is a numerical position for the motor, designated as C. (Note: The relationship between the motor shaft angle and C is determined by the encoder.) The difference between the desired and actual C values is the system error. The controller then converts the error to a control voltage V. The current amplifier keeps the voltage V the same, but increases the current (and power) to drive the servomotor. The servomotor will turn in response to a voltage, and drive an encoder and a ball screw. The encoder is part of the negative feedback loop. The ball screw converts the rotation into a linear displacement x. In this system, the position x is not measured directly, but it is estimated using the motor shaft angle. 
Figure 24.1 A Servomotor Feedback Controller The blocks for the system in Figure 24.1 A Servomotor Feedback Controller could be described with the equations in Figure 24.1 A Servomotor Feedback Controller. The summation block becomes a simple subtraction. The control equation is the simplest type, called a proportional controller. It will simply multiply the error by a constant Kp. A larger value for Kp will give a faster response. The current amplifier keeps the voltage the same. The motor is assumed to be a permanent magnet DC servo motor, and the ideal equation for such a motor is given. In the equation J is the polar mass moment of inertia, R is the resistance of the motor coils, and Km is a constant for the motor. The velocity of the motor shaft must be integrated to get position. The ball screw will convert the rotation into a linear position if the angle is divided by the Threads Per Inch (TPI) on the screw. The encoder will count a fixed number of Pulses Per Revolution (PPR). 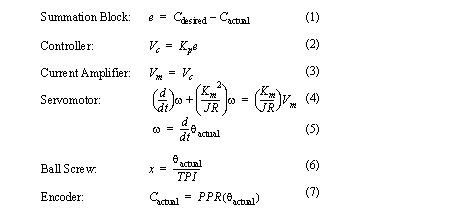
Figure 24.1 A Servomotor Feedback Controller The system equations can be combined algebraically to give a single equation for the entire system as shown in Figure 24.1 A Combined System Model. The resulting equation (12) is a second order non-homogeneous differential equation that can be solved to model the performance of the system. 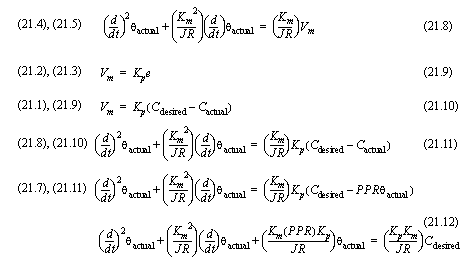
Figure 24.1 A Combined System Model A proportional control system can be implemented with the ladder logic shown in Figure 24.1 Implementing a Proportional Controller with Ladder Logic. The control system has a start/stop button. When the system is active Run will be on, and the proportional controller calculation will be performed with the SUB and MUL functions. When the system is inactive the MOV function will set the output to zero. 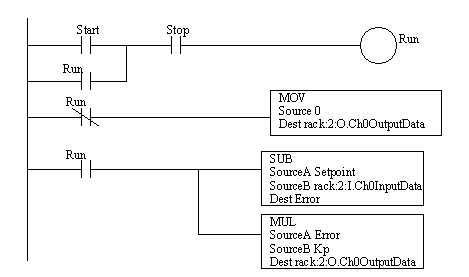
Figure 24.1 Implementing a Proportional Controller with Ladder Logic This controller may be able to update a few times per second. This is an important design consideration - recall that the Nyquist Criterion requires that the control system response be much faster than the system being controlled. Typically this controller will only be suitable for systems that don’t change more than 10 times per second. (Note: The speed limitation is a practical limitation for a SoftLogix processor with reasonable update times for analog inputs and outputs.) This must also be considered if you choose to do a numerical analysis of the control system. 24.2.4 PID Control SystemsProportional-Integral-Derivative (PID) controllers are the most common controller choice. The basic controller equation is shown in Figure 24.1 PID Equation. The equation uses the system error e, to calculate a control variable u. The equation uses three terms. The proportional term, Kp, will push the system in the right direction. The derivative term, Kd will respond quickly to changes. The integral term, Ki will respond to long-term errors. The values of Kc, Ki and Kp can be selected, or tuned, to get a desired system response. 
Figure 24.1 A PID Control System shows a (partial) block diagram for a system that includes a PID controller. The desired setpoint for the system is a potentiometer set up as a voltage divider. A summer block will subtract the input and feedback voltages. The error then passes through terms for the proportional, integral and derivative terms; the results are summed together. An amplifier increases the power of the control variable u, to drive a motor. The motor then turns the shaft of another potentiometer, which will produce a feedback voltage proportional to shaft position. 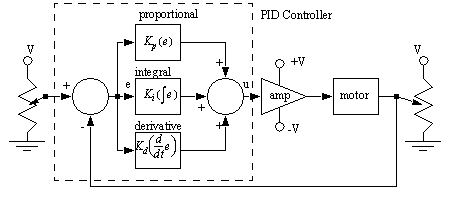
Figure 24.1 A PID Control System Recall the cruise control system for a car. Figure 24.1 Different Controllers shows various equations that could be used as the controller. 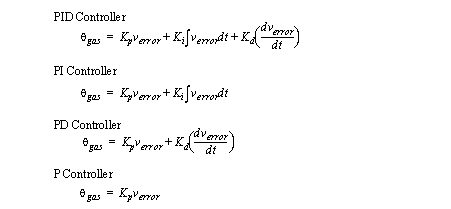
Figure 24.1 Different Controllers When implementing these equations in a computer program the equations can be rewritten as shown in Figure 24.1 A PID Calculation. To do this calculation, previous error and control values must be stored. The calculation also require the scan time T between updates. 
The PID calculation is available as a ladder logic function, as shown in Figure 24.1 PLC-5 PID Control Block. This can be used in place of the SUB and MUL functions in Figure 24.1 Implementing a Proportional Controller with Ladder Logic. In this example the calculation uses the feedback variable stored in Proc Variable (as read from the analog input rack:2:I.Ch0InputData). The result is stored in the analog output rack:2:O.Ch0OutputData. The control block uses the parameters stored in pid_control to perform the calculations. Most PLC programming software will provide dialogues to set these value. 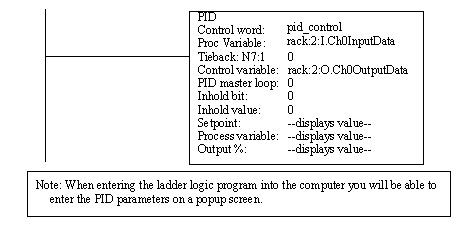
Figure 24.1 PLC-5 PID Control Block A description of important PID parameters is given in the following list assuming that we have defined ’pid:PID’. At the upper end the parameters can be set to generate alarms and verify system operation. For example, many of the limit values are a function of the integers used for analog IO values, and will be limited to -4096 to 4095. pid.EN:BOOL - the PID function is enabled and running pid.DOE:BOOL - 0=d/dtPV; 1=d/dtError pid.SWM:BOOL - 0 = automatic, 1 = manual pid.PE:BOOL - 0=independent PID eqn; 1=dependent pid.NDF:BOOL - 0=no derivative smoothing; 1=derivative smoothing pid.NOBC:BOOL - 0=no bias calculation, 1=yes pid.NOZC:BOOL - 0=no zero crossing calculation; 1=yes pid.INI:BOOL - 0=not initialized; 1=initialized pid.SPOR:BOOL - 0=setpoint not out of range, 1=within pid.OLL:BOOL - 0=above minimum CV limit; 1=outside pid.OLH:BOOL - 0=below maximum CV limit; 1=inside pid.EWD:BOOL - 0=error outside deadband; 1=error inside pid.DVNA:BOOL - 0=ok; 1=Error is below lower limit pid.DVPA:BOOL - 0=ok; 1=Error is above upper limit pid.PVLA:BOOL - 0=ok; 1=PV is below lower limit pid.PVHA:BOOL - 0=ok; 1=PV is above upper limit pid.KP:REAL - proportional gain pid.BIAS:REAL - feed forward bias pid.MAXS:REAL - maximum scaling pid.MINS:REAL - minimum scaling pid.SO:REAL - set output percentage pid.MAXO:REAL - maximum output limit percentage pid.MINO:REAL - minimum output limit percentage pid.UPD:REAL - loop update time in seconds pid.ERR:REAL - scaled Error value pid.OUT:REAL - scaled output value pid.PVH:REAL - process variable high alarm pid.PVL:REAL - process variable low alarm pid.DVP:REAL - positive deviation alarm pid.DVN:REAL - negative deviation alarm pid.PVDB:REAL - process variable deadband alarm pid.DVDB:REAL - error alarm deadband pid.MAXI:REAL - maximum PV value pid.MINI:REAL - minimum PV value pid.TIE:REAL - tieback value for manual control pid.MAXCV:REAL - maximum CV value pid.MINCV:REAL - minimum CV value pid.MINTIE:REAL - maximum tieback value pid.MAXTIE:REAL - minimum tieback value pid.DATA:REAL[17] - temporary and workspace (e.g. integration sums) When a controller is off it can drift far from the setpoint and have a large. If the controller is reengaged this error will be integrated, potentially resulting in a very large integral value. As the PID equation approaches the setpoint it may not be able to handle the large error and shoot past the setpoint. This phenomenon is known as windup. The tieback value is used to overcome this problem by allowing a smooth transfer from manual to automatic mode. PID controllers can also be purchased as cards or stand-alone modules that will perform the PID calculations in hardware. These are useful when the response time must be faster than is possible with a PLC and ladder logic. |